July 2021 – Economic and Market Update
Executive Summary
- A little bit of fear, but a lot of good, comes from being invested right now.
- Predicting the future is a fickle thing, but a common concern is that the U.S. will go the way of Japan with the amount of debt we are taking on as a percentage of GDP.
- The government looks like it will be spending some more money; let’s take a look at where it will go and what can be taken from it.
“It must be a poor life that achieves freedom from fear” – Aldo Leopold from A Sand County Almanac
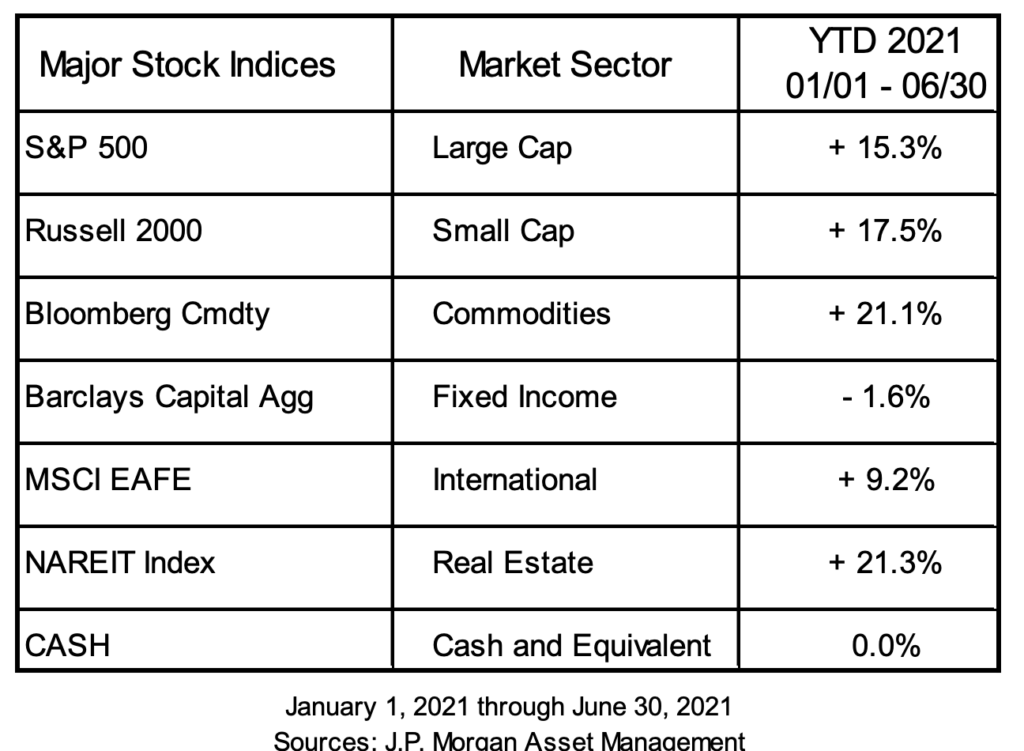
This quote from one of the foremost conservationists in the history of the United States has nothing to do with the markets, but sums up the general feeling we have with investing right now. A healthy dose of fear in lofty valuations coupled with a consistent investment philosophy has resulted in solid performance year-to-date, i.e. a good life instead of a poor one. With inflation on the table, real estate and commodities are the best performers year-to-date. If inflation proves transitory, we expect the commodity price increase to play itself out. For example, the price of lumber made the news just a couple months ago when the price jumped three-fold from pre-pandemic levels. Since that time, as you can see in the graph below, it has plummeted.
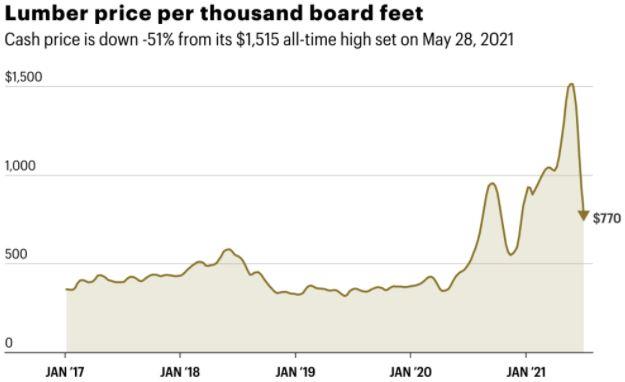
Commodity price volatility is not a new thing. After all, we are all acquainted with seeing prices at the pump jump around. Volatility has also hit the real estate market in ways that have many people questioning the rationale of buying a home. The median list price of a home in the Boise, Idaho market has increased 32.4% year-over-year as of May 2021. For everyone buying and selling homes right now, we sincerely hope prices in the real estate market do not prove as fickle as the price of lumber.
The worst performer so far this year is fixed income, down 1.6% as of June 30. As we discussed in prior economic updates, we continue to be very careful in our approach to handling fixed income. We do not want to get trapped reaching for yield when/if interest rates rise. Interest rates can rise quickly, and reaching for yield can leave us high and dry when that happens. We will maintain our conservative fixed income stance for an indefinite period of time. This strategy continues to payoff as we are up 1% in our Core Fixed Income portfolio relative to the negative 1.6% of the benchmark Barclays Aggregate Bond Fund.
The Future Is a Fickle Thing
Our interesting piece of information for the day is brought to you below by a historical representation of music industry revenues over time. If you grew up in the 90’s you might argue revenue peaked because music also peaked, but that is a fight for another day. The reality is that peak revenue occurred when the technology for file-sharing really took off. After all, why buy music when someone somewhere else in the world already did, and they are willing to share it with you for free? A long precipitous decline in music industry revenue followed until the last decade when streaming services took over and revenue began to increase again.
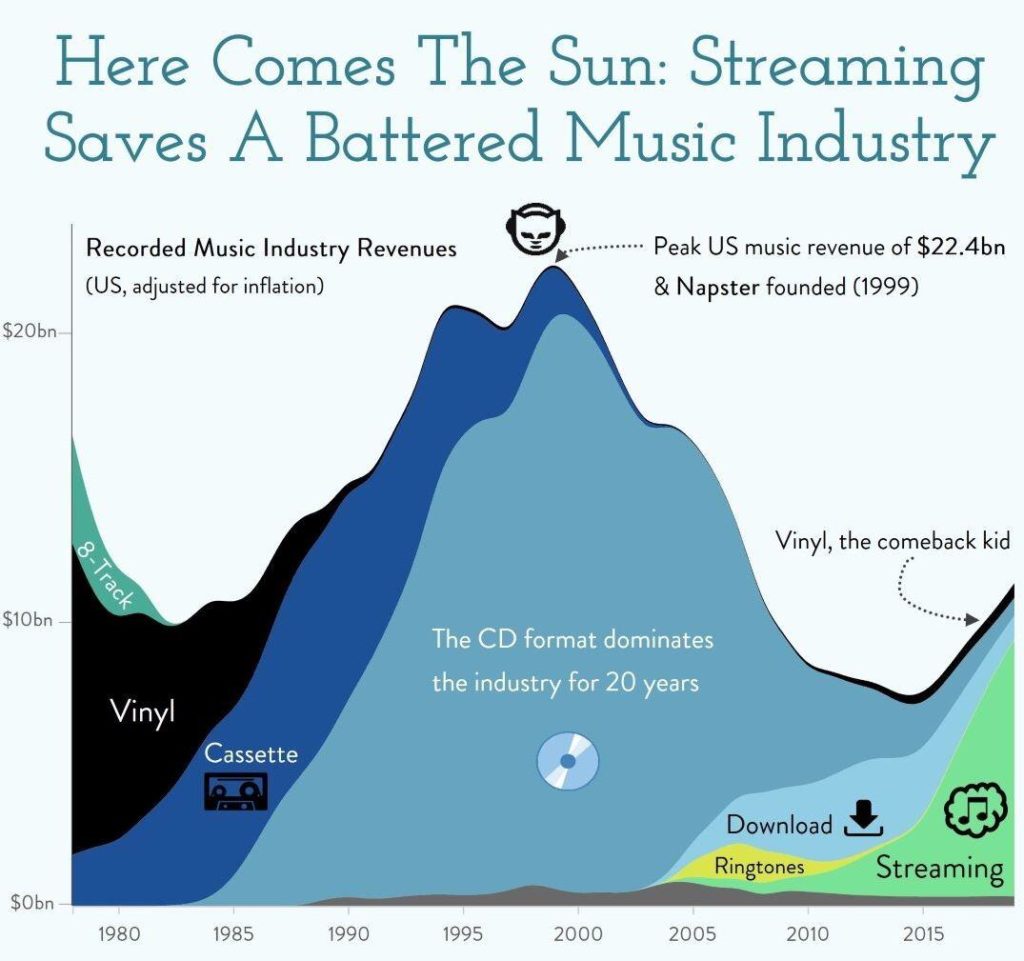
This tidbit is here for two reasons, it is interesting, and it made us think about the Debt-toGDP ratio of Japan, which really started to take off in the late 90’s. When you stare at different graphical illustrations enough, odd connections start to form.
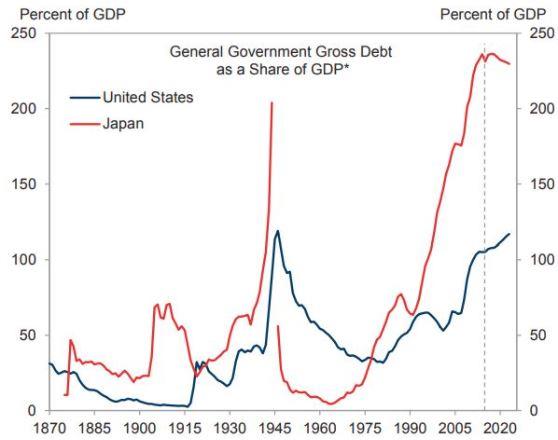
For illustrative purposes, we are comparing Japan to the United States. Rapidly rising debt in Japan roughly maps out to the peaking of music industry revenue, but unlike revenue, the debt load has not rapidly decreased. Most of us have probably heard someone lament that it would be terrible to have the U.S. economy end up like the Japanese economy. Generally speaking, that means low GDP growth, low wage growth, low or negative inflation, and perpetually low interest earnings on savings.
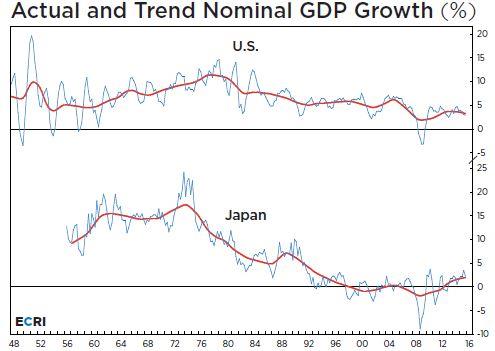
As you can see in the graph above, as public debt exploded, GDP growth trended down over time. It would be nice to think that peak debt in the United States would follow a path similar to the music industry, with the dramatic decline being a good thing (debt paid down) rather than a bad thing (revenue down). Such an event has happened in the past. The previous peak in the US, which we are now approaching, was during the WWII years when massive government spending was necessary to handle war expenses.
The Japan to U.S. comparison leads to a generalized conversation we have had with other financial advisors and investment managers as of late, which might sound familiar. It always starts something like this:
“Moving forward with continued borrowing and credit spending to spur growth, how do we see that debt impacting portfolios 10, 20, and 30 years into the future?”
The conversation goes in a lot of directions, but the general consensus is for a downtrend in the value of the dollar to be the long-term strategy to get out of the debt overhang. How we deal with this will be a work in progress if it manifests. We will do our best to diversify as we see how/if a downward trending dollar impacts portfolios. Part of our strategy is whether or not a drop in the dollar matters as long as the U.S. remains the best looking pig in the barnyard, so to speak. As long as we remain the best looking economy in the world we believe this issue is decades away versus being right on our doorstep.
“But, we can’t print (money) our way out of this problem (COVID) and expect it to end well.”
In our prior economic update, we focused on how countries trying to print their way out of an economic problem experienced hyper-inflation, typically coinciding with some other systemic shock. We have already made the case that we do not see hyper-inflation, or even very high inflation, as an issue. What we do see as a big potential problem is much slower growth in the future, a la Japan. It is a lazy answer, however, to say we will end up like Japan because their issues are far more nuanced than just having a high Debt-to-GDP ratio.
And the conversation always ends with some variant of the following:
“As bad as this feels, we just have to accept it and move on.”
We may not feel good about it, we may not be comfortable with it, and we certainly don’t manage our household finances like what we see happening with our government. It is, however, where we are and we will do our best to navigate the future as well as we can.
And There Is More Money on the Way
The next round of spending looks like it is right around the corner. You may have heard that the Senate has come to terms on a bipartisan infrastructure deal that totals $1.2 trillion over 8 years with $579 billion in new spending on top of baseline planned spending. The dollars are spreadout as you can see below, with the original proposal on the right and the bipartisan deal on the left:
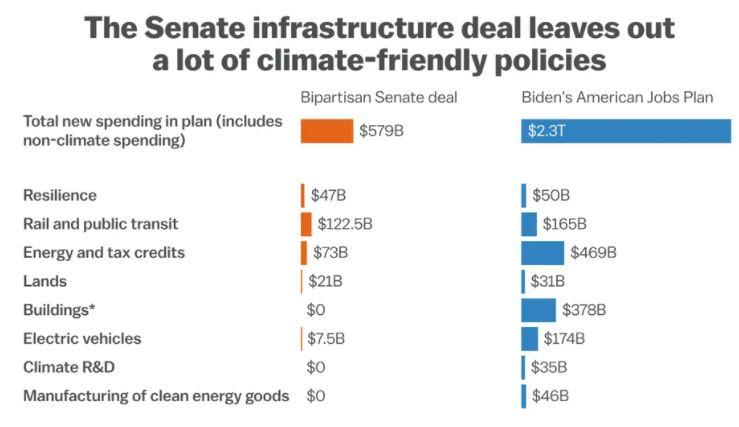
Source: Sierra Club; Vox analysis
The additional spending of $579 billion is significantly less than originally proposed and it is always nice to see the word Bipartisan come across the screen every once in a while. This deal will further increase our debt-to-GDP ratio, but infrastructure is almost always a good place to spend money. None of us want to be driving across bridges which have been rated as past their useful life, drinking from out-dated and carcinogenic pipes, or taking a subway through an old and poorly maintained transit system.
President Obama, President Trump, and now President Biden, have all made infrastructure spending a major talking point. From an economic perspective, there is a reason why. Many studies have been done over the years to look at the return on investment per $100 spent on infrastructure.
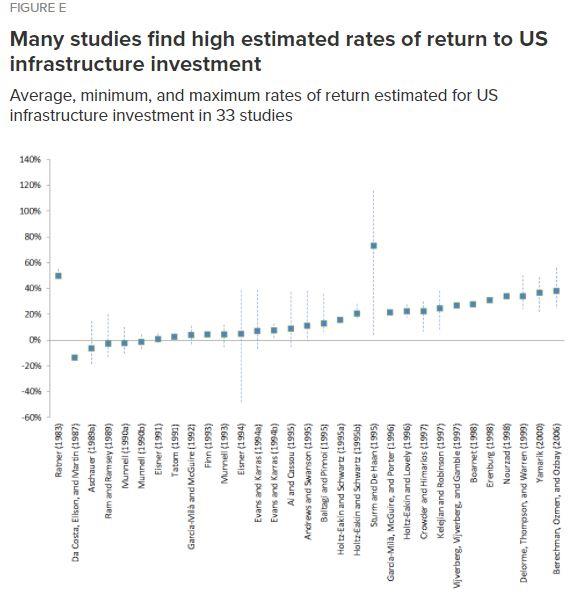
Source: Adapted from Table A1 in Bom and Ligthart 2014, Economic Policy Institute
The average minimum rate of return over time in the various studies is 6.1%. The data points are organized from oldest economic impact study on the left to the most recent economic study on the right. The trend line over time suggests a higher estimated impact from infrastructure investment as the recency of the study trends towards the present day. We have looked at a variety of data points on this and they all point to the same thing; infrastructure spending is generally a sound idea and the return on investment is good. We believe this is a positive in the economic ledger moving forward.
The Planning Corner
On balance, there are more postivies right now than there are negatives. As the year moves forward without any major legislation on taxes it becomes less and less likely that we will see any retroactive laws passed causing major disruptions in how corporations and individuals act.
In our last update we focused on three areas of legislation that we saw ahead. With the deal coming out of the Senate on infrastructure, that list is now down to two and a half pieces of legislation:
- SECURE Act 2.0 (Securing a Strong Retirement Act).
- Bipartisan Infrastructure Framework – still needs to be passed by Congress.
- Tax Reform – continued speculation at this time, not a lot of meat.
The SECURE Act 2.0 is likely the next piece of legislation with major planning needs devoted to it, depending on what types of tax reform are baked into the infrastructure bill. We will keep all of our clients informed on how we see legislation impacting planning as more concrete information is provided to the public.
As always, our desire is to help you make rational, informed and well-reasoned decisions, and we thank you for your continued trust and support. Your input is always welcome, and we ask that you contact us with any questions or concerns.
DISCLOSURE
All information is believed to be from reliable sources; however we make no representation as to its completeness or accuracy. All economic and performance data is historical and not indicative of future results. Market indices discussed are unmanaged. Investors cannot invest in unmanaged indices. Additional risks are associated with international investing, such as currency fluctuations, political and economic instability and differences in accounting standards.
Investing in securities in emerging markets involves special risks due to specific factors such as increased volatility, currency fluctuations and differences in auditing and other financial standards. Securities in emerging markets are volatile and can decline significantly in response to adverse issuer, political, regulatory, market, or economic developments.
An index is a statistical measure of change in an economy or a securities market. In the case of financial markets, an index is an imaginary portfolio of securities representing a particular market or a portion of it. Each index has its own calculation methodology and is usually expressed in terms of a change from a base value. Thus, the percentage change is more important than the actual numeric value. An investment cannot be made directly into an index.
Investing in fixed income securities involves credit and interest rate risk. When interest rates rise, bond prices generally fall. Investing in commodities may involve greater volatility and is not suitable for all investors. Investing in a non-diversified fund that concentrates holdings into fewer securities or industries involves greater risk than investing in a more diversified fund. The equity securities of small companies may not be traded as often as equity securities of large companies so they may be difficult or impossible to sell. Neither diversification nor asset allocation assure a profit or protect against a loss in declining markets. Past performance is not an indicator of future results.
Sean P. Storck and Steven W. Pollock are registered representatives with and securities and Retirement Plan Consulting Program advisory services offered through LPL Financial, a Registered Investment Advisor. Member FINRA/SIPC. Financial Planning offered through Reason Financial, a state Registered Investment Advisor. Investment advice offered through Merit Financial Group, LLC an SEC Registered Investment Advisor. Merit Financial Group and Reason Financial are separate entities from LPL Financial. Tax related services offered through Reason Tax Group. Reason Tax Group is a separate legal entity and not affiliated with LPL Financial. LPL Financial does not offer tax advice or tax related services. Sean P. Storck CA Insurance Lic#OF25995 and Steven W. Pollock CA Insurance Lic#OE98073
1 Lambert, Lance. “Lumber Prices Continue to Plummet-down 49% from the Peak.” Fortune, Fortune, 7 July 2021, fortune.com/2021/07/07/lumber-prices-2021-chart-update-july-price-of-lumber-falling-wood-costs/.
2 Santarelli, Marco. “Boise Housing Market: Prices: Trends: Forecast 2021.” Norada Real Estate Investments, 3 July 2021, www.noradarealestate.com/blog/boise-real-estate/#:~:text=According%20to%20Realtor.com’s%20forecast,over%2Dyear%20home%20price%20growth.&text=According%20to%20them%2C%20the%20median,%25%20year%2Dover%2Dyear.
3 Oh, Sunny. “Here’s a Lesson from Japan about the Threat of a U.S. Debt Crisis.” MarketWatch, MarketWatch, 14 May 2018, www.marketwatch.com/story/heres-a-lesson-from-japan-about-the-threat-of-a-us-debt-crisis-2018-05-14.
4 Bivens, Josh. “The Potential Macroeconomic Benefits from Increasing Infrastructure Investment.” Economic Policy Institute, EPI, 18 July 2017, www.epi.org/publication/the-potential-macroeconomic-benefits-from-increasing-infrastructure-investment/.