
Reason Election Economics
Decoding the election economy
When politicians hit the campaign trail, their first talking point tends to be the economy. Yet, despite the talking points you’re likely to hear, the U.S. economy doesn’t fluctuate dramatically based on who’s in the Oval Office. Here’s what the data has to say about how the U.S. economy has performed under the past two administrations, one Republican and one Democrat.
One thing to keep in mind? COVID-19 hit in the middle of this window, impacting both presidents’ data where noted.
The overall economy
When it comes to the health of the U.S. economy, gross domestic product (GDP) is the primary metric. GDP represents the value of all the goods and services produced by a country. When you compare the value from one quarter to the next, you can see whether an economy is growing or shrinking over time.
If you remove 2020 from the equation to account for COVID-19, the economy grew roughly 2.7% per year under both Trump and Biden, generally aligned with the historical average.
In other words, the economy was strong under both presidents, excluding COVID-19. Of course, our impression of the economy rarely aligns with the big-picture numbers present in GDP. To get a handle on how Americans feel about the economy, we need to go a bit deeper.
Employment and jobs
For most people, having a job (or being able to find work) is the biggest factor in their financial security. If we’re working and earning good money, we tend to be happy with the economy.
But the job market isn’t as linked to a strong economy as you might think. Consider improvements in technology that can increase production (and boost GDP)…but eliminate jobs along the way. On the other hand, consider a company that invests in new hires and high salaries but reports smaller margins as a result.
These mitigating factors fuel most political debates about the economy, but what happens when you zoom out? If you take a step back to look at the headline unemployment rate, we see COVID-19 and inflation impacting the jobs’ picture far more than politics.
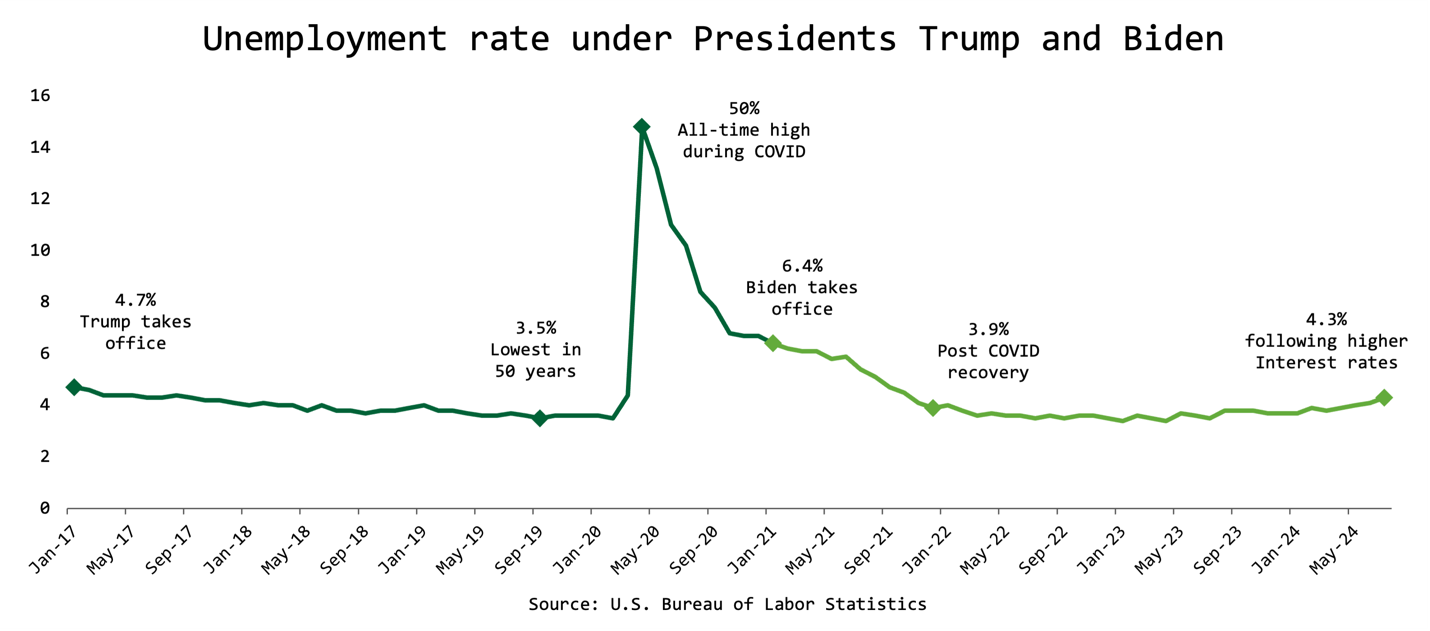
For context: The long-term historical average unemployment rate is 5.69%. In other words—we’re in good shape now and have been for quite some time, as long as we don’t experience another global pandemic.
If that optimism feels misplaced, it may come down to your personal circumstances. Jobs and hiring vary significantly across industry and location. With that in mind, here’s a look at employment in San Diego and Carlsbad (in thousands) per the Department of Labor.
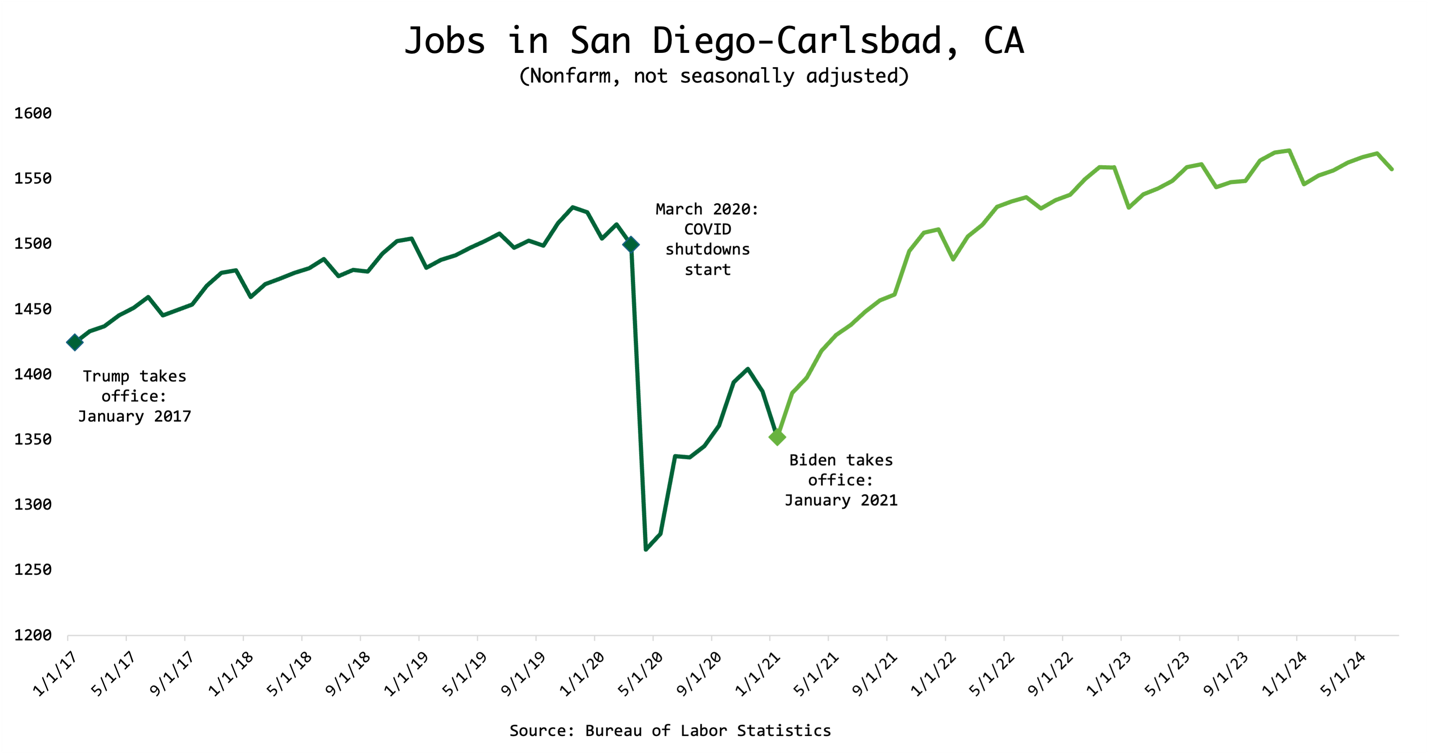
While the headline employment numbers for the country tend to be seasonally adjusted, this data isn’t. But it should give you a sense for how each president did and didn’t impact the jobs market.
If you’re curious which sector of the economy is fueling job growth, the leading source of employment is currently education and health services, which the Labor Department tracks as one category.
Sources: Department of Labor
The big picture on small business
Let’s take an even bigger step back, though, as the headline jobs numbers we hear about in the media don’t paint a complete picture. Monthly jobs data covers nonfarm payrolls—which comprise 80% of the U.S. workforce. In other words, farm workers, active military, non-profit workers, and anyone classified as self-employed aren’t counted in the data.
Even within the data, it’s easy to get the wrong idea. For instance, the government counts education and health care together—as long as we’re talking about private industry. Public school teachers would fall under the 23 million government jobs tracked by the Bureau of Labor Statistics. (Of those jobs, 20 million are state and local government jobs, which include police, fireman, municipal workers, and so on.)
When we dig into the private sector specifically, mega companies still employ more people than small businesses. That said, politicians aren’t lying when they say small businesses are the backbone of the American economy. From 2013-2023, small businesses provided 55% of the new jobs, fueling economic growth. Still, during crises like COVID-19, small businesses were forced to cut more jobs than large companies, even though they bounced back in kind.
(The government views small businesses as any company with fewer than 250 employees.)
Sources: Statista, St. Louis Federal Reserve
Let’s talk taxes
While nearly every politician wants corporations to “pay their fair share,” few agree on the details. To help you process the ongoing back and forth, we looked at corporate filings to see what major corporations actually pay in taxes.
For reference, the current corporate tax rate is 21%, a cut from 35% that was enacted in 2018 as part of the Tax Cut and Jobs Act. But, just like individual filers, companies look for ways to reduce their liability, often with the help of a huge and multinational legal team. Consider a few examples.
- Netflix made $6.2 billion in profit in 2023 and paid less than $1 billion in taxes for an effective tax rate of 13%, according to its regulatory filings.
- Microsoft made nearly $63 billion in the U.S. for fiscal year 2024 and paid an effective tax rate of 19% according to its regulatory filings.
- Tesla, which paid an effective income tax rate of 8% in 2022, paid no income tax in 2023 and, in fact, received a $5 billion tax credit (a -50% effective tax rate) for the year, according to its regulatory filings.
On the personal tax side, the 2018 legislation increased the standard deduction significantly, meaning fewer Americans itemized their taxes. That provision is set to expire at the end of 2025 when the next president is in office.
Tax vs. tariff
We live in a global economy that is dependent on trade. When it comes to the U.S. economy specifically, strong trade relationships benefit U.S. businesses (in terms of what they’re able to export) and U.S. consumers (in terms of a global market for products and services). This is the backdrop to consider when politicians begin to debate tariffs. As a refresher: Tariffs are a tax charged on imported goods. The importing country (or its citizens/companies) pays the tariffs.
If the U.S. imposes tariffs on item X from country A, American buyers of item X pay the tariff, not the exporters in country A. In other words, the government may be hoping to discourage Americans from buying item X from country A. If no other option is available, importers paying higher tariffs may pass those costs on to U.S. consumers.
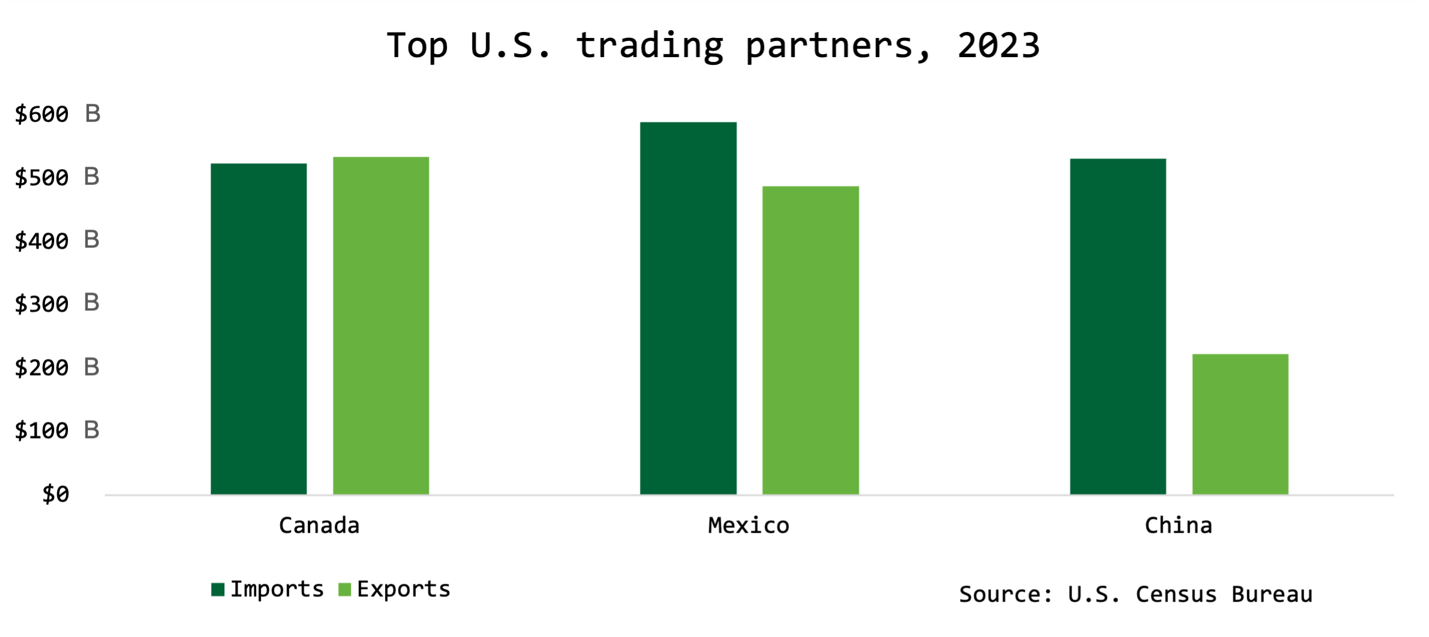
While much of the conversation around trade tends to focus on China, we do significantly more trade close to home. Let’s look at the numbers:
Printing money
Another favorite talking point? Fiscal responsibility. There are three primary talking points when it comes to scrutinizing how the government manages money:
First, the deficit—this refers to the annual budget passed by Congress. If the government spends more than it makes, it runs on a deficit. The last time the Congressional budget had a surplus was 2001.
Given the government is continually running on a deficit, the total national debt—how much the government owes, primarily via Treasury bonds—increases significantly every year.
While the President can simply ask the Treasury Department to print money, there’s another avenue that is talked about far less frequently—the Federal Reserve. When the Federal Reserve hopes to stimulate the economy, it cuts interest rates. If rates are already at zero, it can expand its balance sheet to help. How the Fed does this can be quite complicated, but it ultimately means the Fed asks the Treasury to print money.
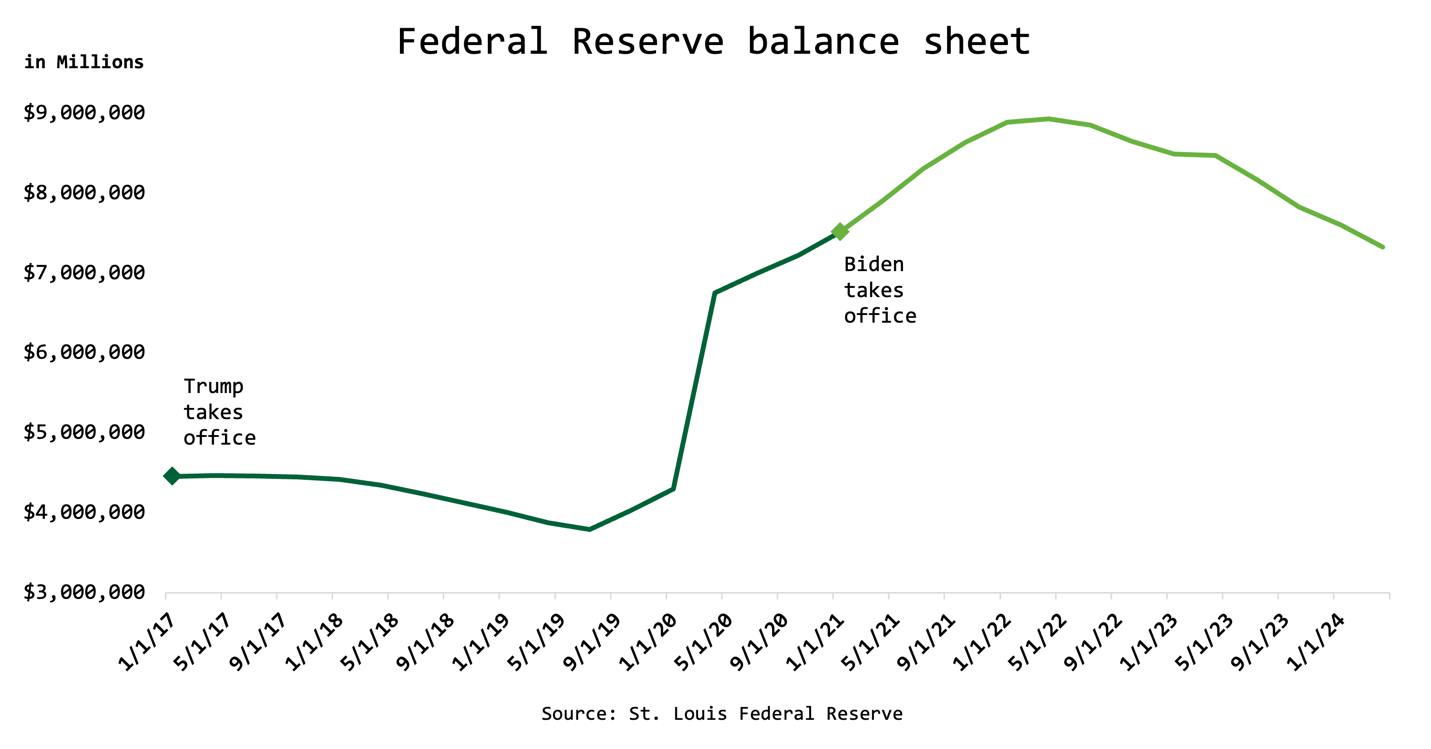
In general, the Federal Reserve explodes or steadies its balance sheet in response to global events and macroeconomic activity, not necessarily the political party in power. Notice how the balance sheet explodes in 2020, which coincides with the Fed’s stimulus programs intended to curtail the devastating effects of COVID-19 to the U.S. economy.
As you might imagine, printing money (even in response to a crisis and outside the scope of the Oval Office) can lead to inflation. However, the Fed expanded its balance sheet significantly in the wake of the 2007 Financial Crisis without a jump in inflation, so it’s not necessarily a given.
Remember: A certain amount of inflation (2-3%) is healthy in a growing economy.
What do these stats mean?
As politicians begin to cite hand-picked economic facts to support their campaign initiatives, context is critical. Simply listening to stump speeches can create a skewed impression of the U.S. economy. In reality, American businesses skew towards innovation and growth historically—and that ingenuity is reflected in the stock market.
While policy changes can have a significant impact on the economy, these changes tend to be slow, and they often pale in comparison to larger global events. Knowing that may help ease any stress you feel going into November.
If you have questions about how specific policy proposals might affect your financial plan, feel free to reach out.
Disclosure
This material is for general information only and is not intended to provide specific advice or recommendations for any individual. There is no assurance the views or strategies discussed are suitable for all investors or will yield positive outcomes. Investing involves risks including possible loss of principal. Any company names noted herein are for educational purposes only.
All information is believed to be from reliable sources; however we make no representation as to its completeness or accuracy. All economic and performance data is historical and not indicative of future results. Market indices discussed are unmanaged. Investors cannot invest in unmanaged indices. Additional risks are associated with international investing, such as currency fluctuations, political and economic instability and differences in accounting standards.
Investing in securities in emerging markets involves special risks due to specific factors such as increased volatility, currency fluctuations and differences in auditing and other financial standards. Securities in emerging markets are volatile and can decline significantly in response to adverse issuer, political, regulatory, market, or economic developments.
An index is a statistical measure of change in an economy or a securities market. In the case of financial markets, an index is an imaginary portfolio of securities representing a particular market or a portion of it. Each index has its own calculation methodology and is usually expressed in terms of a change from a base value. Thus, the percentage change is more important than the actual numeric value. An investment cannot be made directly into an index.
Investing in fixed income securities involves credit and interest rate risk. When interest rates rise, bond prices generally fall. Investing in commodities may involve greater volatility and is not suitable for all investors. Investing in a non-diversified fund that concentrates holdings into fewer securities or industries involves greater risk than investing in a more diversified fund. The equity securities of small companies may not be traded as often as equity securities of large companies so they may be difficult or impossible to sell. Neither diversification nor asset allocation assure a profit or protect against a loss in declining markets. Past performance is not an indicator of future results.
Financial Planning offered through Reason Financial, a state Registered Investment Advisor. Investment advice offered through Merit Financial Group, LLC an SEC Registered Investment Advisor. Merit Financial Group and Reason Financial are separate entities. Tax related services offered through Reason Tax Group. Reason Tax Group is a separate legal entity and not affiliated with Merit Financial Group, LLC. Sean P. Storck CA Insurance Lic#OF25995 and Steven W. Pollock CA Insurance Lic#OE98073
Copyright © 2026 Reason Financial all rights reserved.
Continue Reading
3rd Quarter 2026 – Economic and Market Update
Q2 2026 in review: the S&P 500’s best quarter since 2020, oil’s round trip from $114 back to $70, a 4.2% CPI print that would not quit, and a new Fed chair who took 2026 rate cuts off the table — plus what a 15% quarter means for the allocation you actually own.
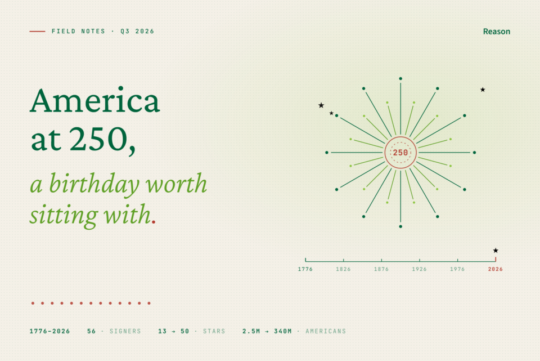
America at 250: A Birthday Worth Sitting With for a Moment
The United States just turned 250 — and the story reads surprisingly well as a series of 50-year check-ins. Founding-era population the size of San Diego County, two presidents with impeccable dramatic timing, a telephone demo in Philadelphia, quarters you’re still finding in your change — and one compounding machine that started counting in 1926.
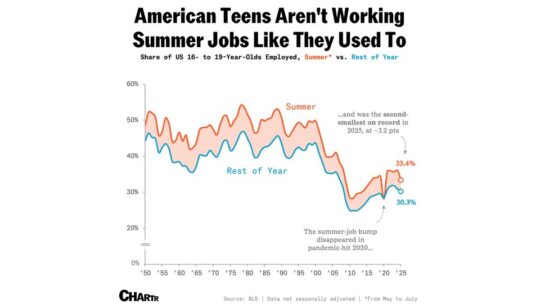
American Teens Aren’t Working Summer Jobs Like They Used To
This Chartr line chart tracks the share of U.S. 16- to 19-year-olds who were employed from 1950 through 2025, split…