2nd Quarter 2026 – Economic and Market Update
AN ECONOMIC AND MARKET UPDATE
Q2 2026 / January 1 – March 31, 2026
EXECUTIVE SUMMARY
- The S&P 500 declined 4.3% in Q1 2026, its worst quarter since Q3 2022, as the Iran conflict drove oil prices above $100 per barrel and reignited inflation concerns that had been fading for much of 2025.
- Commodities dominated the quarter with the Bloomberg Commodity Index surging 24.4%, reaching the highest index measurement since 2022 when we were still in the throes of the Covid induced supply chain nightmare. While the surge in energy prices made the most prominent headlines, commodities are up across the board, including fertilizer which may eventually bring higher food costs. The Bloomberg U.S. Aggregate Bond Index was essentially flat as monetary policy held steady.
- Early Q2 brought a sharp market rebound as the administration outlined a cease-fire framework meaningful enough that stocks rose, oil fell, and yields moved lower in the trading sessions that followed.
After three consecutive years of positive returns in the S&P 500, the first three months of 2026 reminded investors that geopolitics can upend market expectations faster than any earnings report or economic data release. The Iran conflict, which escalated sharply on February 28th, became the single most important variable in global markets for the remainder of the quarter, touching everything from Treasury yields to the price of a gallon of gas at the Costco on Morena Blvd.
The conflict introduced a kind of uncertainty that economic models handle poorly, because unlike a rate hike cycle or an earnings recession, the path forward depends on decisions being made in war rooms rather than boardrooms, and the range of outcomes from here is unusually wide. As we write, early Q2 has already delivered a meaningful shift in that calculus, with reduced tensions amidst a tentative truce/blockade and markets rebounding sharply off their late-March lows, though the structural consequences of the conflict will outlast the diplomatic ones.
OIL, INFLATION, AND THE GHOST OF 2022
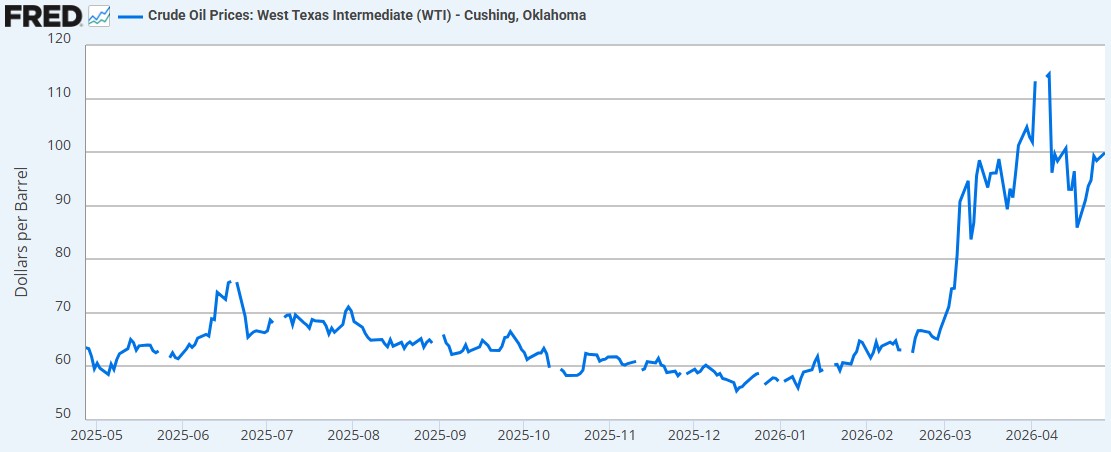
The defining market story of Q1 2026 was oil, and it was not close. West Texas Intermediate crude opened the year below $60 and closed the quarter above $100, driven by a series of escalations in the Middle East that shut down a meaningful portion of global production capacity. Brian Andrew, Chief Investment Officer at Merit Financial Group, noted in his March commentary that “the war has been an inflation story so far,” and that is precisely the framework investors should use to understand the quarter.
Source: U.S. Energy Information Administration via FRED
Sustained elevated prices could shave off a significant amount of GDP depending on how high the price of crude goes and how long it stays there. The worst-case scenario is for crude oil prices reaching $200/barrel. In a recent analysis of the impact of oil prices on GDP, Forbes noted that “a doubling of oil prices would reduce U.S. GDP by 1%”. We started the year around $60/barrel and are now bouncing around in the $100 to $110/barrel range for WTI. Not quite doubling, but we are getting close. Please note that the global oil benchmark is different than the WTI benchmark referenced here.
The single most-watched pressure point, the Strait of Hormuz, has roughly 20% of the oil and petroleum liquids transported around the world move through its narrow corridors. Hence, the reason why at a word from President Trump, or Iran, markets move positively or negatively depending on the content of their statements.
The Bloomberg Commodity Index returned 24.4% for the quarter, its largest gain since 1990, with the energy sub-index alone surging 63%, a number that would have been dismissed as absurd in any January forecast. Gold added to its multi-year run, with the Bloomberg Precious Metals sub-index rising 7%, though that gain looked almost pedestrian next to energy.
What made the oil story particularly difficult for markets was its inflationary transmission mechanism. Higher energy costs feed into transportation, manufacturing, food production, and consumer heating, categories the Federal Reserve has spent years bringing under control post-COVID. Core CPI, which had been trending toward the Fed’s 2% target, began ticking upward again in March, and the Fed funds futures market responded by taking additional rate cuts off the table entirely, with some traders now pricing in the possibility of hikes.
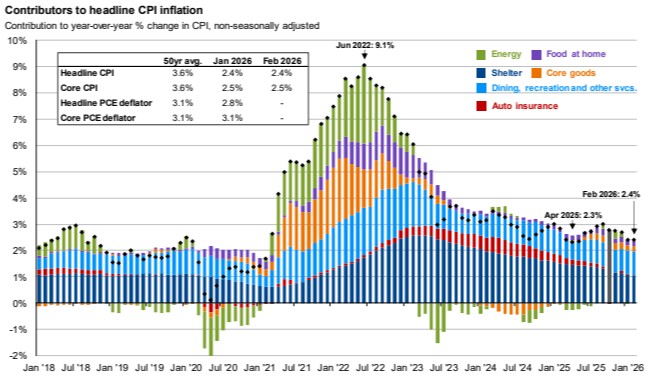
Source: BLS, FactSet, J.P. Morgan Asset Management, Guide to the Markets – U.S. Data are as of March 31, 2026.
For investors the parallels to 2022 are very uncomfortable with 2022 being the last time the S&P 500 ended the year down, along with the worst bond market in a generation. That year, the start of the Russia-Ukraine war sent oil prices over $120 and the Federal Reserve was in the midst of a rate hike cycle. We don’t have a rate hike cycle yet, but the price of energy is expensive, and will eventually make other things expensive along with it.
THE STOCK MARKET: A ROTATION IN PROCESS
The S&P 500’s 4.3% decline for the quarter tells one story, but the path to get there tells another. Through mid-February, the index was essentially flat as investors weighed slowing earnings growth against still-strong employment data. The sharp drawdown came in the final month of the quarter as the Iran conflict intensified and oil prices pushed through the $90 and then $100 thresholds in rapid succession. Then in early Q2, as diplomacy took the stage, the index rebounded sharply with optimism around Middle East diplomacy and hopes of easing financial conditions supporting risk assets.
Source: FactSet, FTSE Russell, Standard & Poor’s, J.P. Morgan Asset Management, Guide to the Markets – U.S. Data are as of March 31, 2026.
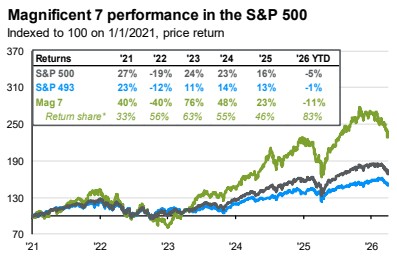
The more interesting story under the surface is the rotation that is now clearly underway. Large cap growth stocks, which had led markets higher for the better part of three years, bore the brunt of the selling, as rising inflation expectations and higher bond yields compressed the premium investors were willing to pay for future earnings. The so-called “Magnificent Seven,” Apple, Microsoft, Amazon, Alphabet, Meta, Nvidia, and Tesla, were responsible for a disproportionate share of the S&P 500’s decline, a reminder that market concentration works in both directions.
Source: FactSet, Standard & Poor’s, J.P. Morgan Asset Management, Guide to the Markets – U.S. Data are as of March 31, 2026.
But the rotation goes further than the usual “growth sold off, value held up” narrative. Year-to-date, value has been outperforming growth meaningfully; small and mid-caps have been outperforming large; and energy, naturally, has been the best-performing sector of the market. Technology was an unusual standout of the kind nobody penciled in: it traded defensively alongside energy and utilities once the conflict started, as investors who had spent 2024 and 2025 piling into AI infrastructure suddenly valued cash flows and balance sheets over growth stories. Market performance is broadening out making purposeful diversification a wise play.
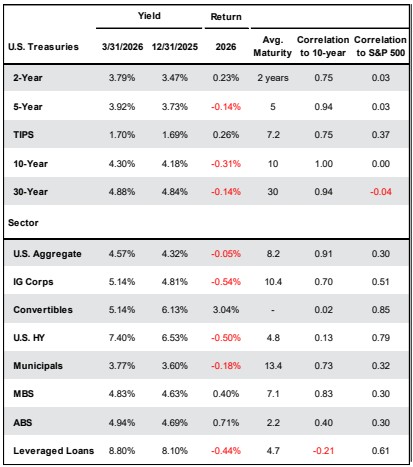
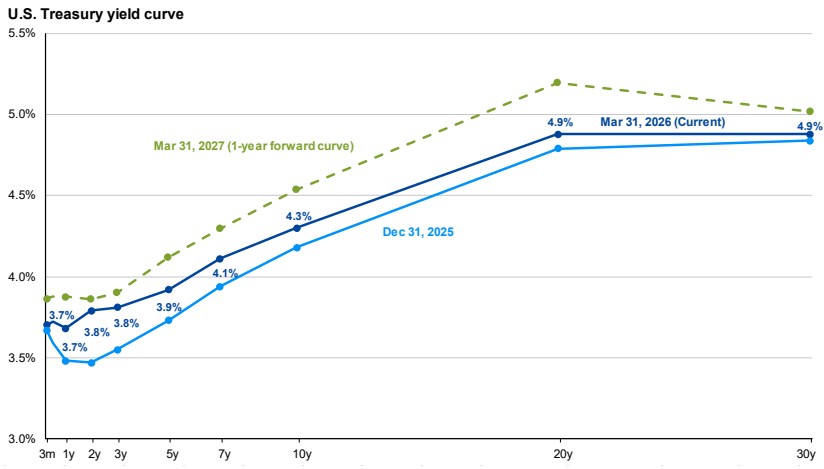
FIXED INCOME: A FLATTER CURVE AND THE RETURN OF CARRY
Bonds did something unusual in Q1: they did not hedge. For balanced portfolios, that meant the usual diversification lifeline did not materialize. The shape of the curve changed meaningfully with short-term rates repriced higher on the back of revised Fed expectations, with the two-year climbing roughly 25 to 30 basis points into the upper-3% range, while long rates remained more anchored. Fed futures now price a higher-for-longer regime the market had previously treated as rhetorical.
Source: Bloomberg, FactSet, Federal Reserve Bank of Cleveland, Standard & Poor’s, U.S. Treasury, J.P. Morgan Asset Management, Guide to the Markets – U.S. Data are as of March 31, 2026.
The silver lining for savers and bond investors is that starting yields are as attractive as they have been in years. With two-year Treasuries near 3.80% and carry doing meaningful work in portfolios, fixed income is again behaving like an asset class worth owning for reasons beyond diversification. In this context, carry refers to the amount you are paid to hold the bond. Shorter duration has outperformed, CLOs and mortgage-backed securities have contributed, and the flattening curve has opened opportunities for repositioning.
Source: FactSet, Federal Reserve, J.P. Morgan Asset Management, Guide to the Markets – U.S. Data are as of March 31, 2026.
THE CEASE-FIRE THAT BECAME A BLOCKADE OF A BLOCKADE
In late March and into early April, headlines around a potential cease-fire framework between the U.S. and Iran sent a jolt through markets. Stocks rallied, oil prices dropped, and Treasury yields fell as investors recalibrated their expectations for inflation and monetary policy. Then there was a highly visible break and what was initially a ceasefire became a blockade in the Strait of Hormuz by Iran, with a blockade of their blockade by the U.S. in the Gulf of Oman. Energy products along with other goods are still not flowing as they were prior to the start of the conflict.
For investors, the implication is straightforward. Energy prices will remain elevated relative to the 2024–2025 environment regardless of the diplomatic outcome, and that backdrop changes the calculus for inflation, interest rates, and equity valuations in ways that a single cease-fire announcement cannot fully resolve. Interest rates and stocks remain intertwined, and yields will continue to drive near-term equity valuations for as long as the market remains focused on the Fed.
INVESTMENT STRATEGY
Against this backdrop, we are making a deliberate shift toward reducing risk at the margins without abandoning the long-term equity allocation that drives portfolio growth. This is the kind of adjustment we believe is appropriate when the macro environment is uncertain, but the economy remains fundamentally sound. As the March jobs report confirmed, the U.S. labor market is cooling modestly but still expanding, and consumer spending, while slowing, has not fallen off a cliff.
It is not time to abandon ship but doing a check to make sure there are not any leaks, and regular maintenance is performed is prudent.
THE FINANCIAL PLANNING CORNER
Quarters like Q1 2026 are exactly when financial planning decisions matter most, not because markets are declining, but because declining markets create opportunities that flat or rising markets do not.
Roth conversions become more attractive when account values are depressed. Converting a traditional IRA to a Roth IRA when your portfolio is down means you pay tax on a lower balance, and any subsequent recovery grows tax-free. The drop in valuations in March was short-lived and hard to plan around. However, if markets begin to show wear due to an extended conflict with Iran, having a conversion strategy in place ahead of time that can be put into action would be a good idea.
Tax-loss harvesting is also worth reviewing. The S&P 500 decline and the rotation out of large cap growth stocks may have created meaningful losses in taxable accounts that can be harvested against gains elsewhere, including the significant gains in energy and commodity positions.
Rebalancing your asset allocation after a quarter with this much dispersion, commodities up 24%, stocks down 4%, and bonds flat, can reset your portfolio to its target weights and capture the mean-reversion tendency that benefits disciplined investors over time. If you have not reviewed your allocation since year-end, now is the time.
As always, our desire is to help you make rational, informed and well-reasoned decisions, and we thank you for your continued trust and support.
— Steve & Sean
DISCLOSURE
This material is for general information only and is not intended to provide specific advice or recommendations for any individual. There is no assurance the views or strategies discussed are suitable for all investors or will yield positive outcomes. Investing involves risks including possible loss of principal. Any company names noted herein are for educational purposes only.
All information is believed to be from reliable sources; however we make no representation as to its completeness or accuracy. All economic and performance data is historical and not indicative of future results. Market indices discussed are unmanaged. Investors cannot invest in unmanaged indices. Additional risks are associated with international investing, such as currency fluctuations, political and economic instability and differences in accounting standards.
Investing in securities in emerging markets involves special risks due to specific factors such as increased volatility, currency fluctuations and differences in auditing and other financial standards. Securities in emerging markets are volatile and can decline significantly in response to adverse issuer, political, regulatory, market, or economic developments.
An index is a statistical measure of change in an economy or a securities market. In the case of financial markets, an index is an imaginary portfolio of securities representing a particular market or a portion of it. Each index has its own calculation methodology and is usually expressed in terms of a change from a base value. Thus, the percentage change is more important than the actual numeric value. An investment cannot be made directly into an index.
Investing in fixed income securities involves credit and interest rate risk. When interest rates rise, bond prices generally fall. Investing in commodities may involve greater volatility and is not suitable for all investors. Investing in a non-diversified fund that concentrates holdings into fewer securities or industries involves greater risk than investing in a more diversified fund. The equity securities of small companies may not be traded as often as equity securities of large companies so finding a market for them may be more difficult.
Financial Planning offered through Reason Financial, a state Registered Investment Advisor. Investment advice offered through Merit Financial Group, LLC an SEC Registered Investment Advisor. Merit Financial Group and Reason Financial are separate entities. Tax related services offered through Reason Tax Group. Reason Tax Group is a separate legal entity and not affiliated with Merit Financial Group, LLC. Sean P. Storck CA Insurance Lic#OF25995 and Steven W. Pollock CA Insurance Lic#OE98073
Copyright © 2026 Reason Financial all rights reserved.