January 2023 – Economic and Market Update
Executive Summary
- 2022 was a bad year for the markets, including bonds. We have been in a cycle of lower-lows with the appearance of another downward trend appearing.
- Inflation is beginning to taper; don’t let localized observations obscure your picture of the broader inflation picture.
- The real estate market is turning a corner for the worse and even industry writers believe it is time to wait and see.
Much of the focus in our last economic update remains in play today. The last three months have not brought much in the way of either increasing optimism or decreasing pessimism. The end of 2022 was a snuffed out Santa Claus rally providing a fitting ending to an otherwise unexciting year. For the first time since the financial crisis, both bonds and stocks were hit hard providing little in the way of cover for investors. A series of lower-highs succeeded by lower-lows provided a reminder that the bottom of a down market is not usually as clean as it was in March/April 2020 during the early days of the pandemic-fueled downturn. It is not easy being patient with markets like they are right now. This cycle is easy to see in the graph below of the S&P 500 from January 1, 2022 to December 31, 2022.

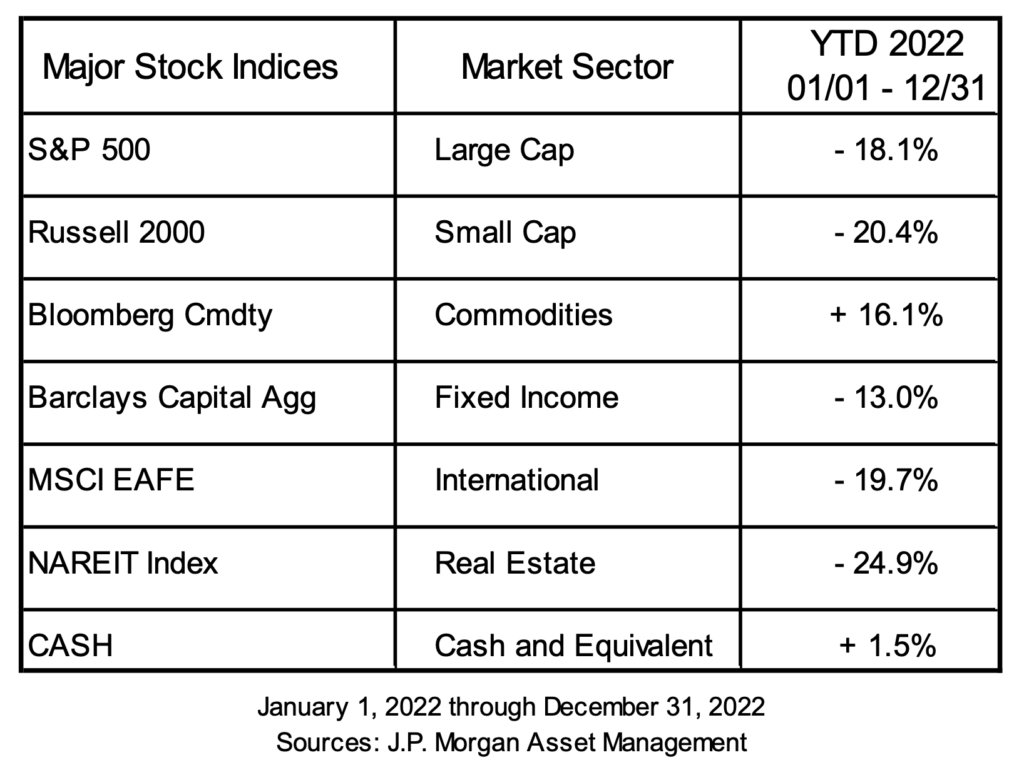
The only positive performers on the year were commodities and cash. This is quite a flip flop to recent history in which commodities were one of the worst performers in 10 of the last 15 years. Fixed income was down -13% providing little shelter with domestic equities also down -18.1%, or worse. On the plus side, the sell-off in bonds as interest rates rose does provide opportunity moving forward for more conservative investors. We will discuss this in more detail later.
Households Are, Almost, Feeling The Pinch
A new phrase has entered the lexicon in the last two years: “Pandemic Cash”. Thanks to government spending coupled with nothing to do, the windfall of “Pandemic Cash” bolstered savings and buffered households against various economic headwinds these last two years. That cash is running out, however, and the Household Debt Service Ratio is rising.
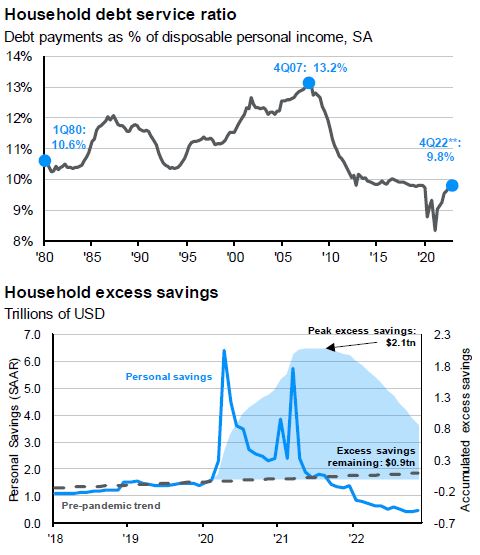
Source: FactSet, FRB, J.P. Morgan Asset Management, Data include households and non-profit organization. Guide to the Markets
As you can see in the Household Excess Savings graph above, there was a significant increase in the amount of cash and cash equivalents on hand for the normal household in the U.S., primarily driven by pandemic related government stimulus programs. Savings peaked in mid-2021 and households have been eating into the funds over the last year and a half. Low interest rates and fiscal stimulus helped reduce the household debt service ratio in the early part of the pandemic. However, dwindling cash reserves and rapidly increasing interest rates are flipping the script. Consumers are running out of cash and debt service ratios are returning to where they were pre-pandemic. That is about to get worse with government programs limiting or stopping student loan payments about to run out. The unfortunate conclusion is that the U.S. consumer is running out of fuel.
This does not mean that markets are going to be trending lower until this plays out. Markets are forward looking. Therefore, we should expect to see this bad news being priced in well before things really start to feel bad. We do believe there are still turbulent markets ahead, but it feels like the final cards of the market downturn are being played.

As you can see above, markets typically hit a bottom before the worst of the worst is being felt by the average household. The vertical black line in each of the graphs above represents the market bottom. With the exception of the Dot-Com bust of the early 2000’s, the market bottom occurred before the end of the recessionary period in grey. This is actually good news. When you can see the light at the end of the tunnel, it doesn’t mean you are at the end, but it does mean you can see the way out. We could not say that 6 months ago.
The Fed Is Ahead
It does not feel like it but the Fed is ahead. This is small consolation when we have been dealing with inflation rates as high as we have. The Federal Reserve is either good or just better than everyone else at being bad. Either way, the U.S. is ahead of the curve at handling inflation. There are a few different ways to look at this; we will start by looking at global inflation.

Inflation is on its way down both domestically and globally. No one is waving a flag signifying the end is in sight as you can see above with inflation in the red in most parts of the world. However, the pace is slowing and it looks like we have peaked. A global slowdown in inflation does not mean that prices are coming down for everything and everyone.
For the San Diego residents among us, S.D.G.E. natural gas bills are certainly not coming down. Eggs and everything related to domestic poultry are another example due to a very severe outbreak of avian influenza. Below is a graph from the CDC website regarding reported avian influenza detection in flocks. If you are not familiar with the processes surrounding bird flu containment, it is gruesome.

S.D.G.E. rate hikes may not change, but egg prices will pass, much like the shipping container mess in 2021 and 2022. Inflation is still high, historically, but it is coming down in the broader sense. Individual items and geographical regions may feel inflation more than others, but it is important not to fall prey to the fallacy of composition. That is, don’t infer that something is true of the whole, based on obesrvations of what is true for part of the whole. Inflation is here, but we are seeing evidence of it subsiding, regardless of inflation tied to specific items or regions.
In his most recent press conference Federal Reserve Chair Jerome Powell made it clear the effects of monetary tightening to combat inflation are not done. “We have covered a lot of ground, and the full effects of our rapid tightening so far are yet to be felt.” The Eurozone is also expecting increased interest rates to continue for some time. In remarks at the World Economic Forum, Christine Lagarde, President of the European Central Bank (ECB), stated that, “We shall stay the course until…we can return inflation to 2 percent in a timely manner”.
Our expectation is for continued rate increases, but for them to be moderate in nature as the Fed looks for evidence of slowing inflation and a less robust job market, with a similar tact coming out of the ECB. During the last 2 years we have skewed very conservative on the fixed income side of our investing thesis. Our motivation for that is clearly visible on the far right of the graph below, with 2022 being the worst year on record for core bonds in 50 years.
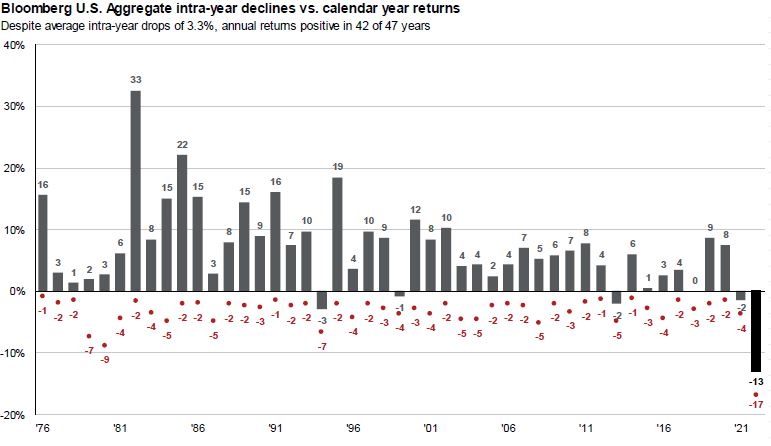
Expectations of rate increases going higher and lasting longer served as the basis for us skewing more conservative than the fixed income market as a whole. We are now entering a period where rates have come to a point that there appears to be opportunity on the fixed income side. We will begin to make adjustments reflecting that opportunity in our investment strategy. This will entail a slow increase in duration as the opportunity presents itself. We do not expect an about-face on interest rate increases by the ECB or the Federal Reserve, but we do expect more moderate rate increases as the full impact of their respective tightening policies take effect.
Real Estate
The problem facing real estate as an asset class can be summed up in the quote below:
“If you’ve got a few months to work with, and you don’t need to sign now, I’d just hold off,” Jon Leckie, data researcher and journalist for Rent.
Higher interest rates make buying harder with rising debt-to-income ratios. Buyers have to make decisions either based on what they can afford today or on the assumption they can refinance to a cheaper loan in the next couple years.
Why do we bring this up? Because personal financial advice does not always run in agreement with economists and gurus. Be patient; wait and see.
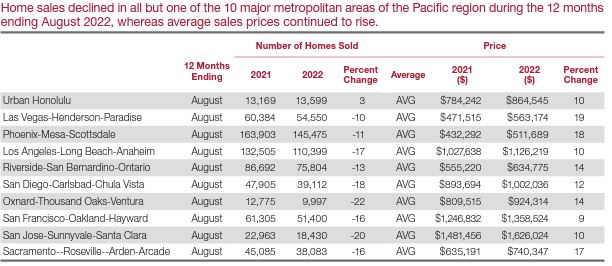
As you can see above, sales were down year over year from 2021 to 2022 in the major metro areas in the Pacific region. However, prices were up over the same timeframe. There is room for a correction. The best time to buy a house is when it makes sense for you. Something we hear often is that people feel like they have missed the boat. Don’t let that feeling override clear-headed decision making. We live in a very expensive region where it feels like it is impossible to buy. Really, it just requires good planning and time. The best advice we have for our clients looking to buy a home is to be patient and prepare. Sales volume is coming down, sellers are beginning to offer concessions, and time is on your side.
The Planning Corner
The SECURE ACT 2.0 has finally passed! After nearly a year of writing about it, we can say it is finally done. The ground it covers is too extensive for summary here. We will provide an informative PDF attachment to our quarterly newsletter in addition to posting it on our website. We encourage you to take the time to read about it and reach out if you have any questions on how this relates to your retirement planning.
As always, our desire is to help you make rational, informed and well-reasoned decisions, and we thank you for your continued trust and support. Your input is always welcome and we ask that you contact us with any questions or concerns.
DISCLOSURE
All information is believed to be from reliable sources; however we make no representation as to its completeness or accuracy. All economic and performance data is historical and not indicative of future results. Market indices discussed are unmanaged. Investors cannot invest in unmanaged indices. Additional risks are associated with international investing, such as currency fluctuations, political and economic instability and differences in accounting standards.
Investing in securities in emerging markets involves special risks due to specific factors such as increased volatility, currency fluctuations and differences in auditing and other financial standards. Securities in emerging markets are volatile and can decline significantly in response to adverse issuer, political, regulatory, market, or economic developments.
An index is a statistical measure of change in an economy or a securities market. In the case of financial markets, an index is an imaginary portfolio of securities representing a particular market or a portion of it. Each index has its own calculation methodology and is usually expressed in terms of a change from a base value. Thus, the percentage change is more important than the actual numeric value. An investment cannot be made directly into an index.
Investing in fixed income securities involves credit and interest rate risk. When interest rates rise, bond prices generally fall. Investing in commodities may involve greater volatility and is not suitable for all investors. Investing in a non-diversified fund that concentrates holdings into fewer securities or industries involves greater risk than investing in a more diversified fund. The equity securities of small companies may not be traded as often as equity securities of large companies so they may be difficult or impossible to sell. Neither diversification nor asset allocation assure a profit or protect against a loss in declining markets. Past performance is not an indicator of future results.
Sean P. Storck and Steven W. Pollock are registered representatives with and securities and Retirement Plan Consulting Program advisory services offered through LPL Financial, a Registered Investment Advisor. Member FINRA/SIPC. Financial Planning offered through Reason Financial, a state Registered Investment Advisor. Investment advice offered through Merit Financial Group, LLC an SEC Registered Investment Advisor. Merit Financial Group and Reason Financial are separate entities from LPL Financial. Tax related services offered through Reason Tax Group. Reason Tax Group is a separate legal entity and not affiliated with LPL Financial. LPL Financial does not offer tax advice or tax related services. Sean P. Storck CA Insurance Lic#OF25995 and Steven W. Pollock CA Insurance Lic#OE98073
1 “Guide to the Markets.” Guide to the Markets, J.P. Morgan Asset Management, 2 Jan. 2023, https://am.jpmorgan.com/us/en/asset-management/protected/adv/insights/market-insights/guide-to-the-markets/. See page 61
2 Smith, Talmon Joseph. “Americans’ Pandemic-Era ‘Excess Savings’ Are Dwindling for Many.” The New York Times, The New York Times, 7 Dec. 2021, https://www.nytimes.com/2021/12/07/business/pandemic-savings.html.
3 Fong Strategist See all articles, Tina. “Schroders Plc.” How Do US Stocks and Earnings Usually Perform during a Recession?, 8 Dec. 2022, https://www.schroders.com/en/us/professional-investor/insights/equities/how-do-us-stocks-and-earnings-usually-perform-during-recession/.
4 “H5N1 Bird Flu Detections across the United States (Backyard and Commercial).” Centers for Disease Control and Prevention, Centers for Disease Control and Prevention, 18 Jan. 2023, https://www.cdc.gov/flu/avianflu/data-map-commercial.html.
5 “Fallacy of Composition.” Wikipedia, Wikimedia Foundation, 22 Jan. 2023, https://en.wikipedia.org/wiki/Fallacy_of_composition#:~:text=The%20fallacy%20of%20composition%20is,is%20also%20made%20of%20rubber.%22.
6 “ECB Will Stay the Course of Rate Hikes, Lagarde Says.” Euronews, 20 Jan. 2023, https://www.euronews.com/next/2023/01/20/davos-meeting-lagarde.
7 Chen, Stefanos. “The Housing Market Is Worse than You Think.” The New York Times, The New York Times, 4 Nov. 2022, https://www.nytimes.com/2022/11/04/realestate/housing-market-interest-rates.html.
8 Harford, Tim. “What Economists Get Wrong about Personal Finance.” Financial Times, Financial Times, 13 Jan. 2023, https://www.ft.com/content/2e91652e-58fa-4744-8ff7-384074fcacba.
9 “USHMC Home: HUD USER.” USHMC Home | HUD USER, https://www.huduser.gov/portal/ushmc/home.html.
Disclosure
This material is for general information only and is not intended to provide specific advice or recommendations for any individual. There is no assurance the views or strategies discussed are suitable for all investors or will yield positive outcomes. Investing involves risks including possible loss of principal. Any company names noted herein are for educational purposes only.
All information is believed to be from reliable sources; however we make no representation as to its completeness or accuracy. All economic and performance data is historical and not indicative of future results. Market indices discussed are unmanaged. Investors cannot invest in unmanaged indices. Additional risks are associated with international investing, such as currency fluctuations, political and economic instability and differences in accounting standards.
Investing in securities in emerging markets involves special risks due to specific factors such as increased volatility, currency fluctuations and differences in auditing and other financial standards. Securities in emerging markets are volatile and can decline significantly in response to adverse issuer, political, regulatory, market, or economic developments.
An index is a statistical measure of change in an economy or a securities market. In the case of financial markets, an index is an imaginary portfolio of securities representing a particular market or a portion of it. Each index has its own calculation methodology and is usually expressed in terms of a change from a base value. Thus, the percentage change is more important than the actual numeric value. An investment cannot be made directly into an index.
Investing in fixed income securities involves credit and interest rate risk. When interest rates rise, bond prices generally fall. Investing in commodities may involve greater volatility and is not suitable for all investors. Investing in a non-diversified fund that concentrates holdings into fewer securities or industries involves greater risk than investing in a more diversified fund. The equity securities of small companies may not be traded as often as equity securities of large companies so they may be difficult or impossible to sell. Neither diversification nor asset allocation assure a profit or protect against a loss in declining markets. Past performance is not an indicator of future results.
Financial Planning offered through Reason Financial, a state Registered Investment Advisor. Investment advice offered through Merit Financial Group, LLC an SEC Registered Investment Advisor. Merit Financial Group and Reason Financial are separate entities. Tax related services offered through Reason Tax Group. Reason Tax Group is a separate legal entity and not affiliated with Merit Financial Group, LLC. Sean P. Storck CA Insurance Lic#OF25995 and Steven W. Pollock CA Insurance Lic#OE98073
Copyright © 2026 Reason Financial all rights reserved.
Continue Reading
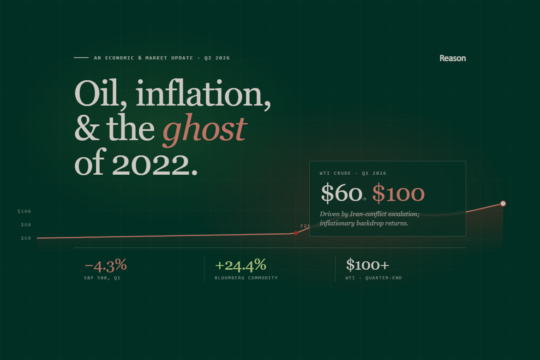
2nd Quarter 2026 – Economic and Market Update
Q1 2026 in review: oil shock, S&P 500 down 4.3%, commodities up 24.4%, the cease-fire that became a blockade — and the planning moves that matter most coming out of a quarter like this one.
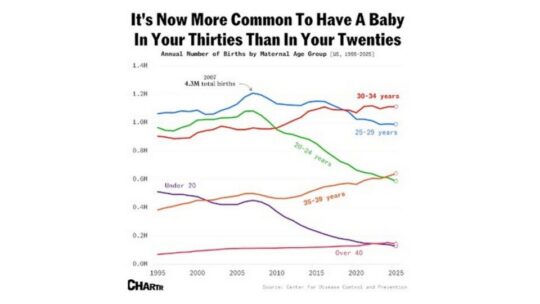
It’s Now More Common To Have A Baby In Your Thirties Than In Your Twenties
DisclosureThis material is for general information only and is not intended to provide specific advice or recommendations for any individual.…

When Does Refinancing Actually Make Sense? A 2026 Reality Check
If you locked in a mortgage at 7% or higher in 2023 or 2024, you’ve probably been watching rates with…