October 2021 – Economic and Market Update
Executive Summary
- Stock concentration in the S&P 500 is leading us to make changes in how we allocate between passive and active management.
- Supply chain delivery times are a good indicator of the path of inflation; businesses are taking notice and expressing lengthened expectations on normalization of their supply chain.
- Job growth missed expectations again amid rising retiree rates and high household net worth, but on the plus side Social Security payments will get a massive boost.
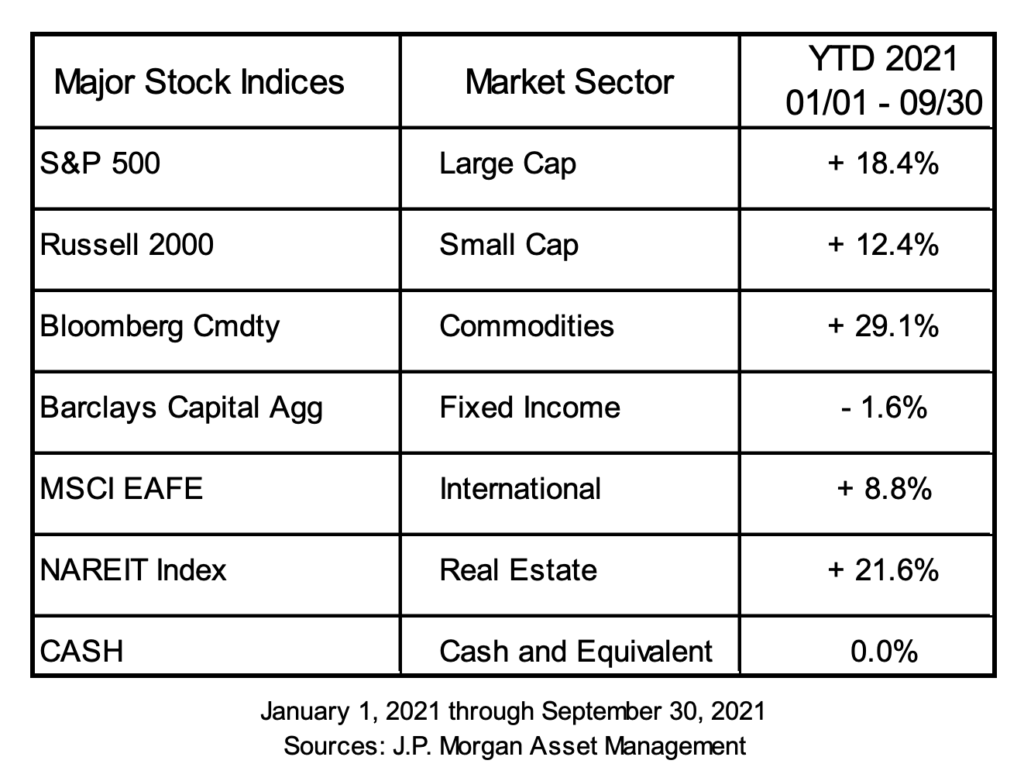
Equities continue to be positive on the year and bonds continue to be a problem. This was not an unexpected situation as we noted back in the spring our anticipation of inflation to outpace Fed estimates. The duration of this inflationary event remains to be seen, but the clock is ticking. At some point consensus estimates of transitory inflation will prove true or become consensus estimates of some new time duration. We have taken substantial steps to adjust the positioning of the fixed income sleeves of our investment portfolios to deal with the possibility of a more rapid rising rate environment than is currently estimated.
On the equity side we continue in our broad asset allocation strategy. A recent quote in Bloomberg perfectly sums up how it feels to invest right now: “Pick a direction, and don’t go with it”. This particular quote referenced the volatile back and forth action in the markets over the last month, but may as well apply to picking a winner in value vs growth, international vs domestic, etc. The S&P 500 is now more concentrated than at any point in the last 40 years, although the graph below only spans 25 years. The collective fortunes of many are tied to the continued out-performance of Apple, Microsoft, Amazon, Google, Facebook, and Tesla.

The top 10 S&P 500 companies are based on the 10 largest index constituents at the beginning of each month. The weight of each of these companies is revised monthly. As of 9/30/21, the top 10 companies in the index were AAPL (6.1%), MSFT (5.8%), AMZN (3.9%), FB (2.2%), GOOGL (2.2%), GOOG (2.1%), TSLA (1.7%), BRK.B (1.4%), NVDA (1.4%), JPM (1.3%), and JNJ (1.2%). The remaining stocks represent the rest of the 494 companies in the S&P 500.
Guide to the Markets –U.S.Data are as of September 30, 2021.
Passive investing works, but when concentration in such a small group of companies reaches these levels it makes sense to find ways to reduce this exposure and diversify away some of that risk. We have been working on this and are introducing updates to the equity sleeves as tax and risk efficiency allow. One final way to look at this is to transpose the S&P 500 performance year-to-date on top of the percentage of S&P 500 index members with a year-to-date drawdown.

The blue portion of the graph is the percentage of members of the S&P 500 which have experienced a 10% or greater drawdown during the year. The yellow line is the max drawdown of the S&P as an index. As you can see, the S&P has touched a 4% pullback on multiple occasions this year while at the same time the percentage of firms experiencing much larger pullbacks is approaching 90%. Those large tech companies mentioned above are disproportionately giving a sense that all is well, when in reality there are substantial issues facing many companies right now. This may be a sign of trouble coming, and it may not, but understanding the internal components and the risk you are exposed to is a necessary element of investing.
CHRISTMAS SHOPPING
The world is an interconnected place and getting goods from point A to point B is complicated. If nothing else, the last 20 months has taught us that. The inflation bug we have talked about this year is complex and shipping is certainly one of the inputs. It is estimated that there are currently 63 container ships sitting off the coast of Long Beach, representing about 12 million metric tons of goods. Scheduling, storage, unloading capacity, land shipping capacity, and other issues are keeping those ships anchored with a large quantity of goods which people and businesses are trying to get their hands on. The very practical takeaway is this – do your Christmas shopping early. The more nuanced takeaway is that supplier delivery times and Core Price Inflation (CPI) are correlated.

Scarcity of goods can take place in a number of ways but having it take forever to get from them over there to me over here is not usually one that comes to mind when much of our shopping is now done via Amazon Prime. As you can see in the chart above, CPI increases in the last year have followed increases in PMI Suppliers’ Delivery Times. Over the last 20-ish years this correlation of moves in the supplier delivery time being mirrored in some way in CPI has turned out to be eerily coincidental. It follows that if something is scarce or abundant for whatever reason, even if that reason is accessibility by delivery, prices will change accordingly.
Another way to look at this is in terms of Inventory-to-Sales Ratio. Just to be clear, our job is not supply chain logistics and we are certain to over-simplify. However, there are some very broad takeaways.

Shaded areas indicate U.S. Recessions
The lower the figure in the graph above, with a most recent reading just above 1.1, the shorter period of time available inventories can cover contemporaneous retail purchases by consumers. Currently, 1.1 months of inventory are available to cover current sales, making the logjam of ships sitting off of coasts around the world a real problem should any sneeze occur somewhere else in the supply chain.
As of a few months ago an Amazon delivery center was opened a couple hundred yards from our office. The rumble of trucks going up and down Jutland is a small reminder of the interconnectedness of the system. It is unclear how long this disruption in supply chains will last, but it is clear that businesses are lengthening their expectations of when they will return to normal.
The Federal Reserve Bank of Dallas operates monthly business outlook surveys available on their website, www.dallasfed.org. Their most recent survey question in September asked, “When do you expect your supply chain to return to normal?” The data is is not encouraging.

In June, 52.6% of respondents believed it would be 7 months or greater for the supply chain to return to normal. As of September that number had increased to 63.3% of respondents. With inflation tracking delivery times, low inventory available to cover current sales, and business expectations of supply chain normalization deteriorating, “transitory” inflation is starting to look a little more “intermediate”. This provides additional context for our reasons behind continuing to monitor portfolio allocations to deal with potentially prolonged inflation. So about that Christmas shopping…
LIVING ON THE EDGE AND GOOD NEWS FOR RETIREES
U.S. job growth was not what it was supposed to be – again. The estimate for September is that 194,000 jobs were added, falling far short of the 500,000 anticipated. Missing job growth expectations is becoming a normal event, while, rather oddly, unemployment continues to fall, now at 4.8%. So how is it possible for job growth to continually miss expectations while unemployment falls? It al comes down to how we define unemployment. As workers fall off the job search list, they become members of the not-employed and not-looking cohort, pulling them out of the unemployment calculation. Labor participation, the percentage of working age adults working or looking for work, is where we see the drop-off.

In a small town in the middle of nowhere we recently had a discussion with our server about the state of hiring. It is a small data point, but one which serves anecdotally to back-up what we hear on the news. The dishwasher position was open and starting pay was $20/hour, but no one was applying. For those of us who began our working life in the restaurant industry, this was eye-watering. In fact, it is so hard for this restaurant to fill positions they are forced to close for business one day a week so staff can have a day off. Good pay and a day off are great for workers, but having to close for a day is bad for a restaurant, unless you are Chick-fil-A.
The recovery in labor force participation is likely to take longer than anticipated to return to 2019 levels, if ever. Household debt service ratios have plummetted, household net worth is as high as it has ever been, and people near or at retirement age have used the last 20 months as a great reason to retire. If wages need to rise in order to attract workers, it stands to reason that prices will have to rise to cover those higher wages, leading to additional pressure on inflation.

The projected forward retirement figures from February 2020 indicated roughly 2.1 million fewer retirees than actually retired over the last year and a half. This all adds up to a tough labor environment, higher wages for those working, and higher prices for those paying for goods and services. As households run out of stockpiled cash from pandemic assistance it stands to reason many will return to work pushing the participation rate higher, but with more people retiring the potential increase will be muted. Higher wages and higher prices will likely be a fixture of the near to intermediate future as we adjust to the new normal.
On the plus side retirees are in for a treat. The largest COLA (Cost of Living Adjustment) in the last 4 decades will result in a 5.9% increase in Social Security payments to recipients in 2022.
FINAL THOUGHTS
The debt ceiling fight has gained a lot of coverage in recent weeks. The politicking around what will most certainly be a true increase versus the temporary extension we have recently seen, will continue to be front and center. History, as they say, rhymes. Every administration since Eisenhower has raised the debt ceiling at least once, and usually multiple times. This has happened in split party rule and one party rule. To think that it will not happen now, whether you like it or not, just does not make a great deal of sense. Some level of market anxiety has occurred during the fight over raising limits in the past, but returns in the last 30 years after a shutdown have generally been positive.

From the chart above you can see our last handful of shutdowns. With the exception of 1990, everything worked itself out in the end to a positive degree. The past is no guarantee, but there is a strong track record of markets seeing through this type of ordeal. At this time, we are not taking any exceptional action to prepare for turbulence related to the debt ceiling.
The potential passing of the $3.5 trillion bill being debated in Congress is of far more consequence than the debt fight. There are many changes being proposed to both taxes and retirement planning. We will bring updates to the forefront as a more solid bill takes shape. At this point it is pure speculation while the various factions fight for what they want, or in D.C parlance, “make sausage”.
As always, our desire is to help you make rational, informed and well-reasoned decisions, and we thank you for your continued trust and support. Your input is always welcome, and we ask that you contact us with any questions or concerns.
DISCLOSURE
All information is believed to be from reliable sources; however we make no representation as to its completeness or accuracy. All economic and performance data is historical and not indicative of future results. Market indices discussed are unmanaged. Investors cannot invest in unmanaged indices. Additional risks are associated with international investing, such as currency fluctuations, political and economic instability and differences in accounting standards.
Investing in securities in emerging markets involves special risks due to specific factors such as increased volatility, currency fluctuations and differences in auditing and other financial standards. Securities in emerging markets are volatile and can decline significantly in response to adverse issuer, political, regulatory, market, or economic developments.
An index is a statistical measure of change in an economy or a securities market. In the case of financial markets, an index is an imaginary portfolio of securities representing a particular market or a portion of it. Each index has its own calculation methodology and is usually expressed in terms of a change from a base value. Thus, the percentage change is more important than the actual numeric value. An investment cannot be made directly into an index.
Investing in fixed income securities involves credit and interest rate risk. When interest rates rise, bond prices generally fall. Investing in commodities may involve greater volatility and is not suitable for all investors. Investing in a non-diversified fund that concentrates holdings into fewer securities or industries involves greater risk than investing in a more diversified fund. The equity securities of small companies may not be traded as often as equity securities of large companies so they may be difficult or impossible to sell. Neither diversification nor asset allocation assure a profit or protect against a loss in declining markets. Past performance is not an indicator of future results.
Sean P. Storck and Steven W. Pollock are registered representatives with and securities and Retirement Plan Consulting Program advisory services offered through LPL Financial, a Registered Investment Advisor. Member FINRA/SIPC. Financial Planning offered through Reason Financial, a state Registered Investment Advisor. Investment advice offered through Merit Financial Group, LLC an SEC Registered Investment Advisor. Merit Financial Group and Reason Financial are separate entities from LPL Financial. Tax related services offered through Reason Tax Group. Reason Tax Group is a separate legal entity and not affiliated with LPL Financial. LPL Financial does not offer tax advice or tax related services. Sean P. Storck CA Insurance Lic#OF25995 and Steven W. Pollock CA Insurance Lic#OE98073
Copyright © 2021 Reason Financial all rights reserved.
1 Wang, Lu. “The Stock Market Hasn’t Been This Frenetic Since Early In The Pandemic.” Bloomberg.com, Bloomberg, 5 Oct. 2021, https://www.bloomberg.com/news/articles/2021-10-05/stock-traders-rethink-their-own-moves-at-fastest-rate-in-year.
2 S&P 500 Companies – S&P 500 Index Components by Market Cap, https://www.slickcharts.com/sp500.
3 Kay, Grace. “Nearly Half a Million Shipping Containers Are Stuck off the Coast of Southern California as the Ports Operate below Capacity.” Business Insider, Business Insider, 6 Oct. 2021, https://www.businessinsider.com/shipping-containers-stuck-california-ports-combat-shortages-2021-9.
4 Smith, Colby. “US Jobs Growth Unexpectedly Weak in September.” Subscribe to Read | Financial Times, Financial Times, 8 Oct. 2021, https://www.ft.com/content/57ed92ab-994b-4fed-b422-518a0562c698.
5 Hsu, Andrea. “These Older Workers Hadn’t Planned to Retire so Soon. The Pandemic Sped Things Up.” NPR, NPR, 23 Aug. 2021, https://www.npr.org/2021/08/23/1028993124/these-older-workers-hadnt-planned-to-retire-so-soon-the-pandemic-sped-things-up.
6 Omeokwe, Amara. “Social Security Benefits to Increase 5.9% for 2022.” The Wall Street Journal, Dow Jones & Company, 13 Oct. 2021, https://www.wsj.com/articles/social-security-cola-increase-2022-11634067648.