What is the yield curve and why does it matter?
What is the yield curve and why does it matter?
It’s hard to predict a recession—when to expect one, how severe it might be, and what a recovery could look like. And yet, for all of the variables around predicting a potential recession, there’s one indicator that has been largely accurate, predicting every U.S. recession since the 50s: the yield curve.
The yield curve is a basic function of how interest rates work, and changes to this curve can tell us quite a bit about the economy it reflects. In this article, we’ll dig into what the yield curve is, why it’s used as a recession indicator, and what it’s been telling us over the last few years.
Interest rates and yields
To understand the yield curve, you must understand how interest rates are determined. In the United States, it all starts with the Federal Funds Rate (often abbreviated Fed Funds Rate), which is set by the Federal Reserve. This is, at the most fundamental level, the rate that banks charge each other for overnight loans when they need to bolster their reserves. If banks must pay more to borrow, they in turn charge higher rates on the money they lend to businesses and consumers, and so on.
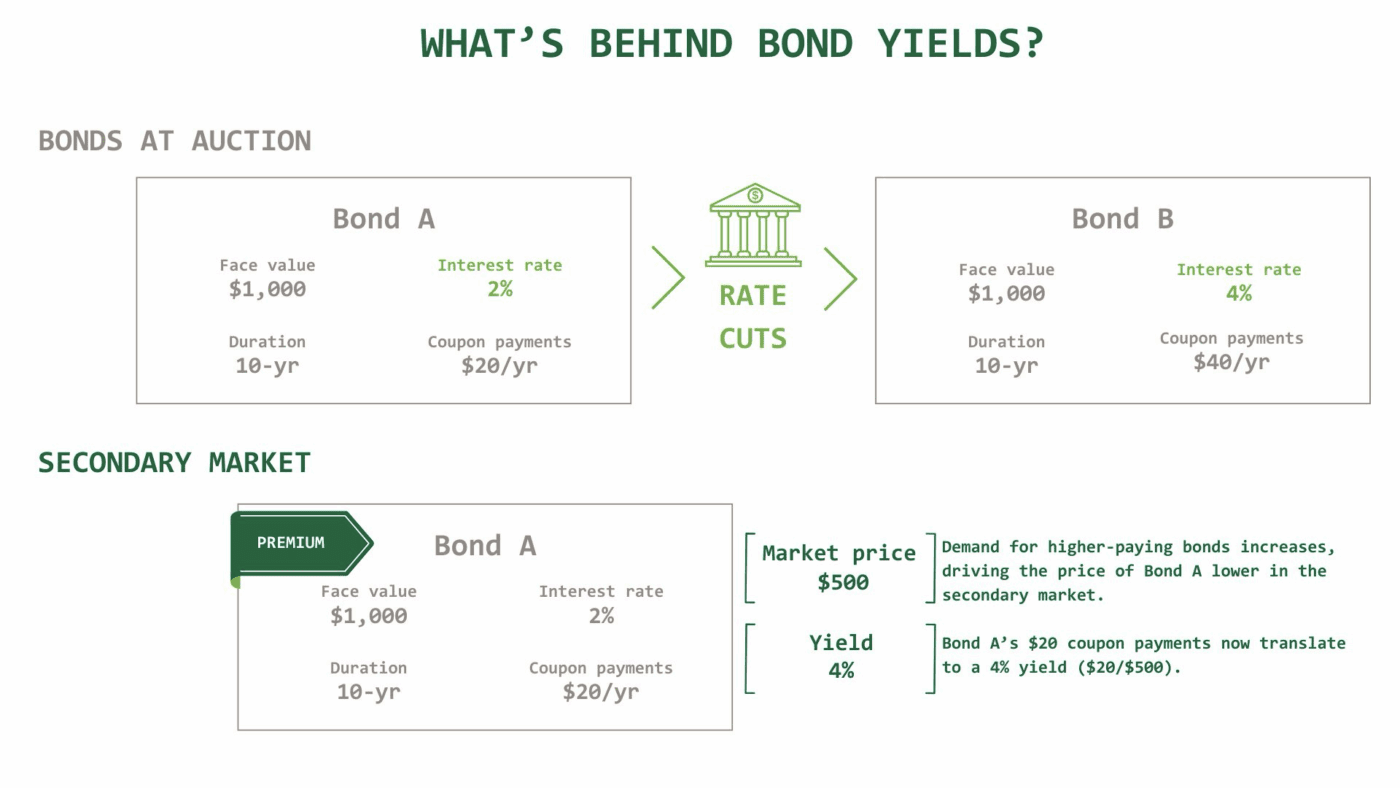
The Fed’s decision on rates also impacts the bond market. More specifically, the Fed influences the interest rate paid on short-term Treasury notes. When the Fed raises its target rate, yields tend to increase, particularly on short-term bonds.
When the Treasury starts to issue new bonds with higher interest rates, the price of existing bonds—bonds traded in the secondary market—tend to fall. Yields climb as a result.
Remember: Yield and interest rates aren’t the same thing. If a $1,000 bond pays $20 in interest, the yield is 2%. However, if the price of that bond falls to $500, and it continues to pay a fixed interest payment of $20, the yield is now 4%.
Yield plus time
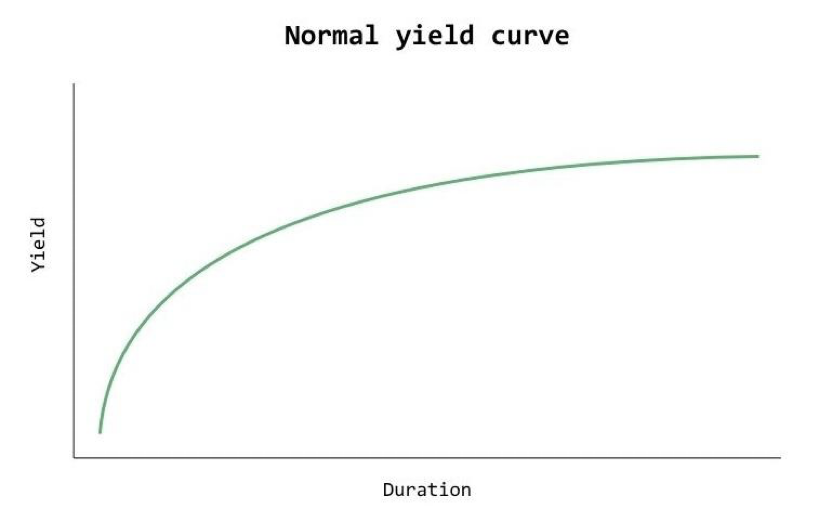
Under normal circumstances, short-term bonds have lower interest rates and yields than long-term bonds. This makes sense when you think about bonds as loans—you take on less risk when you lend someone money for a short period of time. The longer the timeframe, the greater the risk that something will go wrong and the borrower won’t repay the principle.
If you were to plot the average yield on bonds based on their duration, you’d see this risk play out. Short-term bonds tend to yield less; as the duration increases from T-bills to 2-year Treasuries, 10-year Treasuries, on to 20- and 30-year Treasuries, you can see yield increasing.
At least, that’s how it works during normal economic circumstances.
Inverted yield curves
Every so often, the yield curve shifts. The most common shift is a simple flattening of the curve, but it can also fully invert. Inversion usually happens if or when the Fed begins hiking interest rates. Because rate hikes start at the shortest duration possible—overnight lending—and then trickle outwards, rate hikes tend to have a more significant and immediate impact on short-term debt, sending yields higher. Usually, this trickles out into longer-term debt as well, but when that happens, and how significant those yield shifts are, will all show up in the yield curve.
If yields on short-term debt increase more than on longer-term debt, you can end up with an inverted yield curve.
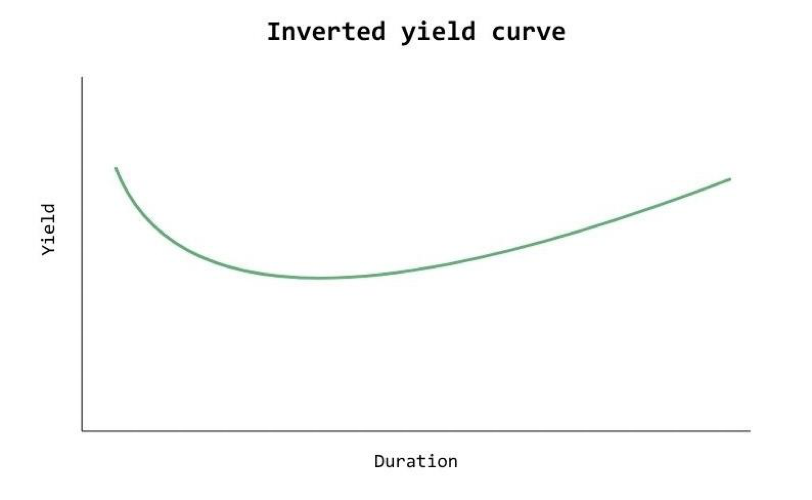
This can create a situation where short-term debt (which is generally viewed as less risky pays a higher yield than longer-term debt. This creates less incentive to lend money for a longer time period—the additional risk isn’t being compensated with higher yields.
While higher yields on short-term debt can create opportunity (for instance, cash-equivalent products may offer attractive returns), an inverted yield curve tends to signal economic trouble. It can indicate a disconnect between the perceived risk and reward of long-term investments in growth; it may also indicate that investors will hold off on making longer-term investments until economic conditions feel more predictable.
Taken in this light, you may start to see why an inverted yield curve has preceded every major recession in the U.S. since the 50s.
There is a catch, however. Just because inverted yield curves are a good predictor of economic trouble, they can’t predict the severity of the economic reaction or the timing of it.
Consider this: The yield curve inverted in 2006, a full three years before the economy officially entered a recession in 2009, in the wake of the financial crisis. Another significant yield curve inversion? The late 1970s when Paul Volcker’s Fed raised rates aggressively to combat inflation.
The yield curve post-COVID 19
More recently, the yield curve inverted in July 2022 and stayed largely inverted through the end of 2024. We haven’t yet experienced a recession. Does that mean we’re due for a downturn, or that the yield curve is no longer serving as an accurate indicator?
The answer may be: It depends. Some experts think we did experience a mild recession in 2022, as initial GDP reports showed two quarters of contraction. However, the government body in charge of officially declaring a recession—the National Bureau of Economic Analysis—did not count it as such. Retrospectively, this makes sense; later revisions to GDP showed the slowdown wasn’t as significant as first readings suggested.
However, we have continued to see economic uncertainty. The economy contracted in the first quarter of 2025. The situation seems to have corrected itself—the economy grew again in the second and third quarter.
Still, there are reasons to keep an eye on the factors that tend to contribute to a recession, such as the job market, which is starting to show signs of weakness.
Ultimately, we won’t know whether the inverted yield curve we’ve seen on and off over the past three years was a harbinger of economic trouble for quite some time. In a more practical sense, it can help us spot opportunities for our clients (such as the potential to generate higher returns on cash equivalents), and it serves as a helpful input as we continually evaluate the health of various markets and the economy overall.
If you have questions about interest rates, yield, or general economic outlook, subscribe to our newsletter or request an appointment.