April 2023 Call
GMT20230413-140137_Recording_1920x1080.mp4
Speaker1: [00:00:30] Hey, good morning, everybody. Thank you for joining us this morning. I think we still got a few more people popping in, but I’m going to go ahead and and get started. There’ll be a pretty standard agenda for us today. We’ll go through some economic data, brief politics update, and then discuss some strategy talking points. We’ve of course, some changes have been executed in some of the satellite strategies recently especially. And we’ve still got some things we’re looking at in the core strategies that we will discuss here on the call. As always, while we go through the material, if you have questions and you want to send them in the chat, please feel free to do so. I’ve got the team logged in here who can try to answer them live. And then of course, at the end, if we have some extra time, which I think we will today, we can also take some live questions. Wanted to start off with a look at the economic dashboard quickly and just point out a couple of metrics. I know. Don’t pull this in every every single time we get together, but I think it’s worth referring back to on occasion to see how things are moving and developing. So the couple of things I wanted to highlight here is we’re still getting, as you look at the our orange line, our current line, clearly there’s there’s a blend of good and bad concerning and not concerning indicators. And this is really why we have a multitude of indicators to look at because we can’t just focus in on on one individual thing, say everything’s fine and you can’t do the same thing to say everything’s bad either.
Speaker1: [00:02:17] Clearly the inflation indicator there at the top is still in the red area and that’s unlikely to change, I think, in the shorter term. And of course it’s been there for over a year now. We are still seeing the unemployment rate is still extremely low. One interesting thing about that metric is that it actually bumped out bumped guess towards the center of the the web here last month because there’s actually a threshold where if the unemployment number gets too low, that that can actually be a somewhat negative indicator reflects a really tight labor market, which of course, is what we’ve been experiencing. But we are starting and have been seeing some slowing in some of the labor market momentum indicators. I’ve got some more data on that that I’ll address a little bit later. Some of the leading indices are also weakening. And then the other big thing that I am going to talk about here in a second is the valuations metric. So in the market sell off in 2022, valuations did start to look more attractive. They weren’t extremely attractive by any means, but they were starting to look more attractive. Obviously we were well off the highs of the valuations that we hit in 2021, But with the rally so far this year, that rally along with, you know, that’s not that’s not coming with increasing in earnings means that the the valuations metric is actually looking a little less favorable again.
Speaker1: [00:03:52] And that is going to be a theme for what we start with here today. So the rally so far this year really has been this reversal rally. A lot of what performed the worst in 2022 has actually performed the best this year. If you look at this chart, I thought it was an interesting way to look at it. The median stock performance for the S&P 500 is actually negative so far this year, down 2.4%. But a lot of these tech growth names Nvidia, Meta, Tesla, Salesforce and Apple have clearly had really strong years. And again, this chart is actually as of the a little bit weeks ago in March. So we’re actually some of these numbers are even a little bit higher for some of the tech names. I think since then it’s been this reversal rally, which is has really changed the market dynamics so far this year. Another way to look at it, you know, we looked at some individual names, but tech in general, the tech sector within the S&P 500, that relative performance is now actually back to some of the historical highs and actually high, high levels that we really hadn’t seen since the.com era. So we’re not necessarily I don’t highlight this to say that we’re forecasting a dotcom like collapse in valuations and performance, but just to show how how big the swing has been, if you even look at the right side of this chart, the swift uptick in relative performance for the tech sector in particular.
Speaker1: [00:05:28] And so this, of course, has has impacted our model performance so far this year. But I think it’s also important as we look ahead to the rest of the year and inform our outlook. When we see this, we have to ask ourselves a question as to why this is happening, what’s generating this type of performance and rally. Again, just a slightly different way to look at it is the high beta names relative to just the S&P 500. Again, it’s been this high beta tech growth sector led rally so far this year. And I will get in to some of the why here in a second. But I wanted to just keep kind of hammering in on different ways to see what’s been happening. The last thing I wanted to highlight is the equity risk premium. So this orange line, if it’s if it’s moving higher, then stocks are relatively more attractive. And with the recent rally this year, it’s actually come back down to this longer term average. So if we tie this back in to what the economic dashboard was showing us, where where valuations never really got exceptionally attractive. And that’s kind of what we see see here, even in looking at the equity risk premium and now with the recent rally, valuations still and the risk premium still doesn’t seem particularly attractive.
Speaker2: [00:06:55] Now.
Speaker1: [00:06:56] It’s not uncommon. You know, we’ve had this inverted yield curve. For some time. And it’s not uncommon for you to for the markets to experience a rally after a yield curve inversion. I think it’s interesting and the reason why I bring brought this chart into the deck today is that these market rallies, post inversion do tend to fully reverse. Well, I think it’s always hard when you look at historical data like this to, you know, you clearly can’t draw hard and strong conclusions about that’s exactly what’s going to happen this time. But I think it is it’s worth keeping in mind. And while we’re certainly happy that we like to see markets moving higher, we we can’t expect and I don’t think we should expect that we won’t still get more volatility over the course of this year. And this ties back into our strategy and how we’re approaching things. While our our equity exposure has participated in some of this rally, we still haven’t fully participated in the growth in tech sector led rally. And I don’t and that’s kind of by design and that’s not something that we want to change or try to chase just because of what’s happened so far in Q1 this year. And again, I want to talk a little bit about the reasons for the rally as we get into our Fed discussion. But really, it’s just been led by the. Of the assumption and market pricing in of lower interest rates.
Speaker1: [00:08:28] So we’ve already had rates move lower and there’s still this expectation that the Fed will cut rates this year, but we really just don’t see that happening. So again, as we tie back into to our strategy, we don’t think you can bank on and invest in a way where you assume that we’re getting rate cuts later this year. Because I really just think that the market’s got that that pricing wrong. And I think that to invest in that way would open yourself up to additional risk that you really don’t want to assume right now. Um, so we think about why do we think the Fed is unlikely to cut rates. I think this is a great graphical representation of part of our reasoning. So this each dot represents when the first rate cut occurred in a Fed easing cycle and we clearly have on the Y axis our core inflation X axis unemployment rate, which you can see is most of the time the unemployment rate is significantly higher when the Fed starts to cut rates. So the unemployment rate’s increasing as economic activity is slowing, people are losing jobs. There’s a real strong reason for the Fed to feel like they have to stimulate economic growth at the same time. In a lot of these cycles, you don’t see inflation as high as it is right now. The periods where you do see higher levels of inflation along with the Fed rate cut, you go back to the 70 seconds and in the early 80 seconds when we were dealing with really strong inflationary pressures that were really mismanaged by the Fed.
Speaker1: [00:10:00] There was this yo yo cycle of rate hikes followed by rate cuts, and it kept inflation persistent for a longer period of time. And I know the Fed doesn’t want to make that same mistake again. So we tie back this back into the market performance that we’ve seen this year, this huge growth kind of outperformance so far year to date. All really ties back into these expectations around Fed policy and lower lower rates as rates have come down this year. And again, expectations for lower rates and Fed rate cuts towards the back half of this year and the next year. And again, if you believe that, then then you think these these stocks that don’t earn a lot of dollars now, but have all their a lot of their value type of future growth and those seem more attractive, their multiples can expand. But multiple expansion is one thing. Actually having earnings growth that really drives long term success is what we think is more important right now. And that’s just not part of the forecast. Now we’re talking about the Fed and potential for rate cuts. Of course, the reason we’ve had all these rate hikes is because of inflation. And, you know, we just got the March inflation data yesterday.
Speaker1: [00:11:17] And you know, it was interesting the. I saw a really conflicting headlines on the data. So I would see some things about how this inflation came in. Well, under expectations like at a positive kind of tilt towards it. But on the flip side, you look at the core inflation data and it really didn’t do much that was too different from expectations kind of came in in line with expectations. The headline number that includes energy prices had a base effect kind of impact where, of course, energy prices jumped higher last March because that was on the backs of the Russian invasion in Ukraine. So that that huge increase in energy prices. Hello in March of last year offset that year over year price price number. Right now, that’s what this chart is showing. So you see this the green bar down here, actually energy prices being inflationary and pulling the headline number now down. This is the first time in this inflationary cycle that our core inflation number has actually been higher than the headline inflation number. For our purposes, When we really look at inflation, we are going to focus more on the core inflation. I think that’s more accurate. I think that makes a lot of sense. And of course the Fed does as well, which means when we if we’re trying to think about the future path of policy, you need to be more focused on core inflation anyway. And what we’re seeing is, is while there’s still reasons to think and I’m going to touch on a couple that core inflation will continue to subside over the course of this year and that that we have hit peak inflation.
Speaker1: [00:12:55] The fact is inflation is still just much too high. The levels are still too high. And even if we’re headed in the right direction, inflation above 4% or 5%, where we are now is still clearly a problem. And again, this goes back into the why is it that we think the Fed’s unlikely to cut rates this year and this is a primary reason for that. So when I said I still think we’re headed in the right direction, the reasons for that, one of them that we’ve talked about before is housing. And we’ve talked about how housing, especially as part of the CPI calculation, has this lagged effect. So you don’t get decreases or stalls in house prices and rents factored in immediately. Of course, there’s a lag effect to that. We’ve been talking about it where if you look at current indicators, for example, the like the Zillow index, that’s part of this average green line here, these current rent and house price indicators have declined significantly. It’s just not being picked up in the data quite yet. What this chart is showing us is that we could still see some of these lagged effects keep the shelter element of core inflation relatively high. But the forecast and our expectations are still that this the core inflation will come down and shelter will start to help eventually.
Speaker1: [00:14:16] It’s just not quite there yet. Another driver of inflationary pressures. This year has been the labour market wage growth. That’s been an important element because as we talk about Fed policy, the Fed is also closely monitoring the labour market. As long as we have a really tight labour market. Exceptionals like they’ve got more room to hike rates or at least keep rates elevated. So I thought it was interesting to look at what’s being talked about on earnings calls. You can see in this top chart labour shortage being mentioned and really having this exponential growth throughout 2021 and staying pretty elevated throughout the course of 2022. But we started to see mentions of labour shortages start to decrease. So you can see this downward trend. At the same time. Course, in 2020. There are a lot of mentions of job cuts coinciding with the global economic shutdown. Of course, those fell off as labor shortage discussions and problems started to surface. But now the talk of job cuts is starting to increase. Clearly we’ve seen this in the headlines, especially in the technology sector. So the part of the economy that was the most prone to the excesses of zero interest rates is now also, they captured a lot of gains during the low rate period, and now they’re actually getting a lot of those gains back, at least from a economic from a growth standpoint, like we were talking about.
Speaker1: [00:15:43] Their valuations, I think have kind of gotten disjointed from what the current prospects are. But in the tech sector in particular, we’ve seen the most. Most job cuts and job announcements or job reduction announcements in that technology sector. But this is I think this is emblematic of the trend overall, where there are still parts of the economy where we still have some labor shortages, but by and large, hiring is starting to slow down. We do expect the labor market and pressures on wages to start to ease. We think on the economic dashboard, you already saw that showing up in some of the indicators, labor market momentum indicators decreasing. And again, I think that’s backed up in some of the data that we’re seeing. But it takes time. So cooling off doesn’t happen overnight. And I think that’s going to be part of the process that we work through in the course of this year. Another thing to look at is the lending activity and banks tightening of lending standards. So we can see here a pretty significant uptick in the tightening of lending standards, especially for auto loans and credit cards. So some of this and a lot of this is tied to the Fed policy and higher rates and the outlook for slower economic activity. Banks starting to pull back. Then, of course, you factor in the banking headlines and issues that we experienced throughout the month of March, and now you see banks really trying to pull back and rein in and be more conservative in what their lending looks like and trying to strengthen and protect their standing and their status in overall bank health.
Speaker1: [00:17:22] So when you see lending standards tightening, that also is part of why we see this more significant decline in the money supply. So the money supply increases was part of the inflationary pressure when money was free and moving quickly and expanding rapidly. Now we’re on the back end of that, where the money supply is tightening again, tighter lending standards kind of feeding into that. So a lower money supply does start to slow down economic growth. And of course, this is all part of that dynamic that the Federal Reserve wanted to generate in order to get inflation lower. We needed to slow economic growth. And this is exactly what the Federal Reserve has been trying to do. And now we are starting to see the impacts of what we’re starting to feel the effects of this policy. And and I know we’ve talked about this before as well, this policy and the impacts of policy doesn’t they don’t happen overnight. It takes time. We started to feel them towards the end of last year when we finally started to see some progress on some of the inflation data. Certainly over the course of this year, the impacts of the hiking cycle last year and any additional hikes we get this year will start to become more prevalent and filter into the economy in an even bigger way.
Speaker1: [00:18:35] So it’s positive as we look ahead and still gives us confidence that we will get inflation under control. But again, where we kind of differ from, I think some of the market pricing right now is this expectation that inflation really gets under control enough for the Federal Reserve can actually ease policy anytime in the near future. Another interesting data point that we came across is if you look at expectations for earnings versus growth, these seem to be diverging a little bit. Clearly, on the left side, we see consensus earnings estimates for the S&P 500 declining in Q1 this year, but then starting to increase and pick up pretty dramatically over the course of the rest of this year. If you compare that to consensus estimates for GDP growth on a year over year basis. For the rest of this year. So it’s kind of conflicting story where earnings estimates while they come down, it’s possible that maybe they haven’t come down enough to really reflect some of the the economic headwinds that we may be facing. So again, this filters into to our view and the way we’re managing our portfolio is by still continuing to stay in position a little bit more of a defensive manner. We’re not trying to email.
Speaker3: [00:19:55] I wonder who did that. I did not.
Speaker4: [00:19:57] Buy the iPad.
Speaker3: [00:19:59] Yeah, he’s the only ones operating it. The one here in Tulsa is going to be started next week after Norm in the same way. So I wasn’t sure. So see if you can find out who actually called that in. Thanks.
Speaker2: [00:20:17] Steve. Mute your phone.
Speaker1: [00:20:21] Like, Yeah, I can’t. And of course I can’t find a mute all button, but All right. We will keep plugging away here. Last piece, I wanted to take a step back and look at some historical pictures and scenarios of what we could be looking at. And of course, we’ve been talking about the Fed pivot or potential for a Fed pivot. And when we sorry, I’m still I’m still getting a little bit of feedback. I’m going to see if I can figure out this mute.
Speaker5: [00:20:54] Drumbeat all.
Speaker1: [00:20:58] Participants. Here we go.
Speaker4: [00:21:03] A whole lot of extra free time.
Speaker2: [00:21:14] You have to unmute yourself.
Speaker1: [00:21:21] Here we go. All right. Now, I finally figured out how to mute everybody and unmute myself. It’s taken a few years, but we’ve done it. Okay, so this is I’m going to put a bow on the economic section here before passing it off to Joe for politics. But I think it’s worth noting that even these market expectations for a Fed cut and a pivot later this year, they’re they’re less helpful if the economy is actually headed for a recession. So if we go back to a couple of recessionary periods, so zero one and zero eight. Now, these were pretty extreme and severe recessions, which, as I’ve said before, isn’t really our outlook. Even if we do enter a recession for something as severe, certainly as the financial crisis. However, in those periods, even though you got these rate cuts, the the economic uncertainty that came along with that recession and the decreases in earnings for companies meant that equity performance didn’t just take off just because the Fed cut rates, equities did start to to come back Even within the recession, especially in the financial crisis, as the outlook started to improve, which could be tied to the rate cuts. But it wasn’t this kind of immediate reaction to the rate cuts. It started to to really improve the outlook.
Speaker1: [00:22:40] You have to remember, again, for the Fed to actually cut rates, we’re going to see some real deterioration in economic fundamentals. And if we see that, that’s not good for earnings. So again, I tie this back in with what we’ve been talking about, where we’ve had this huge market rally this year, a lot of multiple expansion. So valuations increasing without earnings coming along with it. And you know, we’re just hesitant to to think that we’re out of the woods yet. And really, as it relates to equities and our fixed income positioning, just maintain a preference for quality holdings and focusing on preparing to manage risk as best as we can because the uncertain economic environment and potential issues with earnings on the fixed income side of things we’ve talked about focus on quality, increasing the overall credit quality in that in our core fixed income model as well. So I think those things are going to persist even though what we’re seeing so far in Q1 of this year has kind of it’s been a reversal. And against that trend, I still think longer term, we’re better positioned to have this more conservative outlook that I will pause and hand it over to Joe to discuss politics.
Speaker2: [00:23:55] Great. Thanks, Caleb. So on this first slide, it’s going to be a quick kind of politics discussion for this month. But on this slide, I just wanted to kind of give you a graph on what President Joe Biden’s federal budget is for the fiscal year of 2024, 6.9 trillion inches spending. 1.7 trillion of that is in discretionary spending. So as you can see on the top, that is in trillions. And then what the percentage of the budget would be at the bottom to GDP. Kind of nice that they mesh those two graphs together. Some of the big things that are proposed in this ticket basically comes in strengthening Medicare, Social Security, restoring the full child tax credit and providing increased access to health care and affordable drugs. As we all know, for the past few years, he’s been trying to cover this spending through increases in taxes, reductions in things like 1031 exchanges and buybacks by companies. But just to remind you, all, this budget by the president is actually never voted on. So this is basically just like kind of a political stamp of where he feels for the budget. It’s the wish list, right? It’s the wish list. Yeah. So so just take it with what it is. But it’s always good to kind of see the direction that the president would like to go in when it comes to spending. And this was a very busy month, as you can tell. The US government’s kind of focused on more global kind of focus. And so we’ll start with local and then kind of work our way out globally. But the past few weeks, President Biden started the Investing in America tour.
Speaker2: [00:25:41] He’s visiting 20 states. And basically through that, he’ll be kind of discussing the policies that he’s placed since being president and how those have helped the economy through these tough times. As of, I believe yesterday, he went to go visit Ireland and he’ll be visiting the United Kingdom. The reason for the Northern Ireland trip is to commemorate the 25th anniversary of Good Friday Agreement, which the US was helping in establishing that. So he’ll be making some remarks on that. And also King Charles, the third, invited the President to come visit him in the United Kingdom. So he will be going to do that. Also, Vice President Kamala Harris, she did a three country wide tour to Africa. This all comes from the combating of global business that we have been having with China as of late. So as you can tell, China actually has a big a big influence in Africa. They actually do a lot of their construction and infrastructure. So this is actually she is now making the fifth Biden administration official in three months to visit the country. And that’s due to that fact that China is Africa’s largest two way trading partner. And then Speaker McCarthy met with Taiwan’s president, President Tsai, in Los Angeles. Basically, just reassuring protection and trading a boost in trading with that country. So as you can see, the main focus of the United States has kind of shifted into that global competitiveness with China. So we will be focused on that and just kind of seeing where that leads with United States spending outside of the country.
Speaker1: [00:27:34] Thank you, Joe. Okay, so we’ll get into the strategy section here. And I we’ve had a little bit of a data issue, a data integrity issue with how we generate the risk reward charts. So we had to make a little bit of a change this month and thought I would just try to provide some some more commentary and still get the important talking points out there. And then hopefully we have our data issue resolved by our next call. But some of this we’ve already touched on, especially as it relates to core equity performance. So we have we’ve lagged the ACWI so far year to date. And the real the primary reasons for that are our domestic overweight. So international developed equities have outperformed domestic equities so far year to date. But it’s worth noting that their valuations are still significantly more attractive now than than a domestic equity valuation. So we’re still evaluating opportunities in the international space and think we we could still make a case to say that that some of our international exposure could be shifted and potentially increased because again, the opportunity set internationally is relatively more attractive. The other piece of this is our our relative underweight to growth stocks. A lot of the mega-cap tech names especially we’ve we’ve got a slight underweight to and our more balanced positioning again that was was done we landed here because we wanted to be more prepared for economic uncertainty and have a real strong preference for current cash flows and quality cash flows.
Speaker1: [00:29:15] So quality and cash flow is important to us right now. We think one that that helps in a recessionary or in an uncertain economic environment. And two, even if we do get lower rates, the Fed funds rate isn’t going to be around five perpetually. Right? That’s not a neutral positioning. But the fact of the matter is that rates will be higher, I think, for the next ten years than they were for the last ten years. I mean, of course, you could always see some unforeseen circumstance where the Fed has to cut rates to zero, but they’re going to be very hesitant to to do that. And with that in mind, I think it’s very unlikely that the type of performance we saw over the last decade with huge growth outperformance is going to be the same type of performance we see over the next decade. And even in the shorter term where rates are still significantly higher than the kind of neutral rate that’s the preference for more more balanced exposure. Again, quality and current cash flows we think is prudent and the way to be allocated. So even though it’s led to some underperformance so far your date, I still think the longer term outlook supports this type of allocation and we’ll be better served for being a slightly more conservative in our positioning as we progress over the next several months and next couple of years as well.
Speaker1: [00:30:33] On the fixed income side of things, our our performance is slightly lagged, the AG and that’s really been just attributable to the shorter duration of the core fixed income. Of course, we were short duration last year because of the risk of rising rates, which proved to be the right decision and added value to our our performance relative to the AG last year, even though it was a challenging year and that duration has drifted out slightly. I think Nick talked about that maybe on our last call with some recent changes in core fixed. It shifted out slightly, but it’s still relatively short and that’s really driven by the inverted yield curve. The yield potential, of course, in the shorter end of the curve is better than the longer end. And so that’s where that why that position is stayed kind of where it it has on the shorter side of things. But Nick will also address some fixed income commentary a little bit later. So as we think about the equity side of things, I wanted, I already highlighted this a little bit in the economic overview section, but I just want to really hammer the point home.
Speaker1: [00:31:37] If we look at a comparison of returns so far this year, this the darker blue bar is 2022 returns the this I guess we call it a blue. I don’t know. The lighter blue bar is a 20, 23 year to date number. What you can see clearly and of course, the biggest example is in the cryptocurrency world, which of course we’re not playing in significantly. But it’s it’s actually an interesting indicator. Clearly, some of the assets that were hurt the most last year have been the best performers so far this year. If we look at the Fang Plus grouping over here, so down 40% last year, up 33% this year. And then when you flip it, energy up 65% last year, really the only place to be last year and now actually down so far year to date. And so again, I come back to this just to say we we aren’t going to try to chase this type of performance, especially in. The face of the economic uncertainty that we see right now. So that’s that’s not what we’re we’re trying to do. And I don’t think that’s a prudent way to invest. So even though it hasn’t worked out for us so far this year, I still think that’s that we’re positioned correctly for what the outlook is. Just one other way to look at it is if we look at what the what quality stocks and an emphasis on quality has done after Fed rate hiking cycles, this is going back from 84 up to 2021.
Speaker1: [00:33:05] In each of these timeframes, quality stocks relative to all other equities have tended to outperform after Fed hiking cycles. So again, that goes back to when you get this increase in rates where borrowing costs go up, potential defaults maybe go higher if companies aren’t well capitalized and don’t have strong balance sheets, earnings potentially decrease because rates are higher and economic activity has slowed. And that type of environment, which is where I believe we find ourselves right now, you see quality stocks, stocks with stronger balance sheets, stronger current cash flows and more durable cash flows tend to outperform. And so again, this goes back into why we’re positioned the way we are when it comes to our equity strategies and in particular, core equity. So we’ve been talking about what our main theses are influencing our decisions. Nothing’s changed here. It’s still the same highlights this the what I’ve been talking about the risk of rates staying elevated longer than current expectations could create more significant headwinds for growth stocks. That’s of course, been a big point for us today and this emphasis on current cash flows. Now I’m going to touch on briefly the recent change in the low vol strategy.
Speaker1: [00:34:21] I’m not going to go through each one of these bullet points, but the gist of it and the reason for the change is we had a desire to start to position low vol to ensure that we participate in in a market recovery. But we didn’t want to to overdo our long exposure and actually open low vol up to more significant downside risks. Basically, the way we view low vol is it’s going to have this 30 to 50% allocation to some type of hedge or uncorrelated asset. So we have been at 50% throughout the course of last year. We’ve we’ve bumped that exposure down to 40. And the way I view this is even though we’ve had a rally so far this year in markets, the S&P 500 in particular is still well off the highs that it achieved before the sell off last year. If we were to get another leg down in markets or more volatility, that could be a signal for us where we maybe feel like we could even increase some of our our long equity exposure a little bit more. But like I mentioned, we didn’t want to do this haphazardly. We didn’t want to just increase long exposure and open ourselves up to additional risk. So we did. The more significant change from a holding standpoint was to swap out one of the J.P.
Speaker1: [00:35:38] Morgan hedge funds. We still hold the Jp morgan International Hedged Equity Fund, but the domestic one, we swapped for a different hedged equity product that runs the hedges a little bit differently. Jp morgan looks at their hedges on a quarterly basis. This easterly fund that we’ve replaced it with looks on a monthly basis, and they actually have a tighter band of protection on that monthly basis. So that means that the easterly hedge fund has a lower standard deviation in general than the Jp morgan funds. So again, the idea was to try to increase some of the long exposure without increasing the volatility in a big way in the strategy. Other things that we’re looking at, we we did conduct a review of the American funds models and made some changes on the on the equity side of things to keep the American funds equity model in line with our core equity positioning. No changes were required on the fixed income model. We’re currently reviewing the ESG equity model to ensure alignment with core equity and some changes in positioning there. So it could have some changes to announce there probably by our next meeting. I’m going to kick it over to Nick. All right. Thanks, Caleb. So we’ll talk a little bit about what’s been going on in the rates markets.
Speaker6: [00:36:57] A little bit of credit and especially how everything’s been impacted. We’ve had a softening in economic data. For example, initial jobless claims have been easing up just a little bit. So, you know, some cooling in inflation. And along with all the headlines around the liquidity issues in the banking sector. So we’ve seen a pretty dramatic shift on where the markets expect the Fed to go in terms of Fed funds rate. So this plots out. This may be a little bit hard to read at first. This plots out the rate hike or cut expectations through the beginning of next year. So a bar to the upside indicates a hike downside is cut. And then the blue line is the implied policy rate. So right now, we’re in the four and three quarters to 5% range right now. Market’s leaning towards a 25 basis point hike in the next 2 or 3 weeks. I think May 3rd is the next meeting. But what’s interesting is where the dramatic shift has been. I mean, you know, at one point I think we had hikes priced in through the end of the summer, and now they’re if you start from the top of where the current expectations are to reach that five and a five and a quarter range, they’re pricing in almost three cuts by January of next year. So a really dramatic shift. You know, again, a lot of that’s just feeding off of, you know, some of the incremental moves we’ve seen in the economic data.
Speaker6: [00:38:32] Banking concerns and so forth. But with that being said, you know, this is not the end all, be all. This is all you know, whenever we show this, I just want to give sort of a disclosure that this is all based off of what the markets are pricing in, You know, what what are firms doing in terms of trading Fed funds futures? Because that’s where it’s all based off of those futures. And so just to give you an example, you know how the market could be wrong and we could see some further adjustments to those expectations. But this chart looks back as far as the probability back in July of last year. You know, at that time, they priced prices out to be in the, you know, three and a 2:45 and a half range as of today. And obviously, we’re we’re way above that. We’re, you know, 100, 125 basis points above that. So, you know, whenever we show this, it gives us some direction on what the market’s thinking. But this doesn’t this is not a, you know, a full prediction of what the Fed’s going to do. Pretty sure if everybody knew that, then we’d be pulling it a lot more return. Far is what we’ve seen on the yield curve. Obviously, with a lot of headlines lately and everything I’ve touched on a couple of times already, we had a downward shift in rates. So the way to read this, the top portion of the chart, the green line is the current yield curve as of yesterday.
Speaker6: [00:39:59] So you can see especially in the belly, we had a pretty steep drop there that dashed sort of off gold color is a one month ago. So yeah, pretty significant shift. The short end obviously didn’t move because that’s going to be much more tied to where the Fed funds rate is longer. And just because it takes a bit more to move those rates, this is the long run. Average didn’t move quite as much, but did see a downward movement there. But generally around the 2 to 5 year, pretty pretty significant decrease as the bonds rallied, which, you know, that fed into some of the underperformance we saw in PIX so far year to date. Yeah. With everything going on, I mean, not just in terms of the movement in the yield curve rate volatility. So this chart measures the rolling 20 day price volatility in the two year yields. So significant spike, especially with the bank failures, pretty dramatic increase in that some of that has come back down. But we have seen a bit more movement in rates over the past several weeks. On the credit side, you know, really the same theme, you know, a little bit more softening up. You know, interesting data point here. We tried to make sure we explain it carefully because we don’t want to be too misleading. But the number of defaults that we’ve seen, particularly in the US, has been some of the highest levels that we’ve seen since 2009.
Speaker6: [00:41:31] Now, when I say that that is the number of defaults, not a percentage, not necessarily a dollar amount, but so we have seen some defaults tick higher, but we are still below that long run average. So this chart shows the high yield default rate percentage and we’re right around 1.9%. So that has increased off of the historical lows that we had, you know, 20, 21, 2022, but still well below the long run average of around three and a half. So we could see defaults start to tick up, especially as rates stay persistently high. You know, softening consumer spending, so on and so forth. But so far, nothing that telling us that credit markets are broken yet, but something we’ll continue to monitor And overall, you know. High yield spreads moved out just a little bit. We’re still relatively tight. Long run average is around 550 basis points when you compare high yield versus a treasury. So that’s the spread on that or around 480. But really, a lot of that was driven by what we’ve seen in financials, particularly in the banking sector. You know, the white line, you know, we saw this is investment grade. We’ve seen those spreads widen out from about 100 basis points. And, you know, some of that did come back as opportunities arise because, you know, just the natural widening and rates hit the pretty much the entire sector, some banks more than others, But some of those opportunities have been getting scooped up. And we’ve seen that compress back down just a little bit.
Speaker6: [00:43:08] But so far, you know, financial spreads and financial companies are generally a little bit wider than they’ve been so far this year, which interestingly enough, has been, you know, peaks of interest, particularly on the corporate bond side, just looking for opportunities on that strategy, which we’re hoping to bring more information at, you know, in future meetings. Some other place, you know. Some other things that we’re looking at. So as far as the breakdown sectors and it’s no surprise, I mean, now that we actually have a yield on most fixed income sectors, I mean, they’re sitting on the higher end of what the ten year range has been just given how historically, historically low rates were in the 20 tens. You know, high yield averages around, you know, 8.5% investment grade corporate bonds around 5.2% based off this index. So definitely much more attractive to actually get a return on those bonds just from the from the yield. Now, we do want to be careful that we’re not just scooping up everything that has something attractive to the bar on the far right that’s leveraged loans. 11.3% mean that seems really attractive. But you have to consider where leverage loans were just a couple of years ago, 2021. Some of the indexes had average yield of around 3%. So, I mean, if you think about what that actually means for those issuers, the interest cost loan is nearly tripled on those. And you know, it’s going to get more difficult.
Speaker6: [00:44:47] I mean, bank loans are not ultra long debt instruments. I mean, they think they have an intermediate. Most of them have an intermediate term. And so some of those are going to have to get refinanced and the terms just may not be near as attractive. Those spreads could end up being wider. You know, along with the movement that we’ve seen at the short end of the curve, which could add some some pressure on those issuers and, you know, affect affect their interest coverage ratios. So that’s, you know, that really feeds into why we scaled back on our bank loan exposure last month. We actually took that position out of fixed income. We do have some exposure from some of our more diversified managers, but really just scaling back on that in particular just with those concerns as well as, you know, the potential liquidity issues, just how those instruments trade. We do still favor credit. You know, if you look at us, high yield versus some of the other riskier areas like M euro high yield, I mean, still relatively attractive for what we want. And we also still favor investment grade corporates and looking for opportunities to add their mortgages. You know, something that I think would interest US mortgages and asset backed securities. But there are some other things that we have to consider. And so that could be something that comes down the road. So as far as our current current fixed income thesis, nothing’s really changed.
Speaker6: [00:46:18] We you know, even with the changes that we mentioned last month, you know, our overall thesis is the same. We favor shorter duration, focusing on income generation for for our return for the most part. You know, with that we do tend to favor credit to get that income. We think focusing on areas where there are there are healthier balance sheets even with some of the high yield bonds that we have favor the upper levels of that. So the double B rated and you know, if we have to go lower, typically something higher up on the capital structure like first lien, senior secured, stuff like that. So no major changes there. You know, everything we’ve done up to this point so far has been, you know, incremental in terms of adding, you know, a modest amount of duration and a little bit of quality. But things still pretty much stay the same here. Here’s a rough breakdown of what the portfolio looks like today based off all the holdings we had. Sec yield, which I would say for for the most part is going to be the most accurate for core fixed income. But it’s always good to compare 12 months just depending on the fund and what they what they’re holding. So a little over 5%, which I think falls pretty close in line when we’re, you know, triple-B rated shorter, shorter duration on average, and then the average duration is about 3.2. So, you know, pretty significant underweight versus what you would see from like an AG or a Bloomberg Universal, which which we use as our benchmark, which are around six year duration.
Speaker6: [00:47:55] All right. Now, as far as drift, this is a lot to look at and I should have done a little bit better, better breakdown. But I did take notes. So, I mean, as far as for 60 over 40, I know I didn’t break it down between the equity and fixed and fixed income here. I promise I’ll do that next time. But there’s not a anything screaming at us that we need a rebalance at this point. I think we were slightly overweight, uh, slightly overweight equities, but nowhere near the levels of two and a half plus two to trigger a rebalance, you know, along some of the things that Caleb highlighted before. You know, we had a rally in growth so far this year. So we have growth overweight. Um, you know, so if we just look only at equity at 64 basis points, international has done pretty well at 38 basis points there. Some of the the underweights versus the target is going to be on the value side and small cap. We have seen some give back this year in those areas. So something we’re keeping an eye on, like I said, not enough to make us feel like we need to rebalance, you know, across the board. But something we continually look at, if there is an opportunity, if we do rebalance, whether it’s, you know, selling bonds to buy stocks, selling stocks, buy bonds, you know, that’s something we look at on a frequently.
Speaker6: [00:49:19] And then really quick you won’t read through everything. Just wanted to highlight what some of the base level changes were that we have done over the past month. So between low vol American funds equity and core fixed plus low vol, Caleb highlighted some of those some of those items between changing the hedge exposure. As well as adjusting how how we get our international and long exposure American funds. Adjusting that portfolio within the American funds universe to to follow along the core changes that we’ve made. Core plus you know, part of that change, you know, as a reminder, core Plus is kind of a three piece component or three piece portfolio takes a little bit of absolute return, alternative income and core fixed income, you know, based off of some of the changes we made in core fixed income, we fed that through to core Fixed plus, as well as made an adjustment to the market neutral exposure for another market neutral fund. Interesting strategy actually pays out monthly income, which does fit the bill pretty well for a fixed strategy. As far as where we are with the changes, we’re about 95% completed Everything that’s left over either gains issues on the equity side or or just some one off pieces that we have to approach, particularly in the core fixed plus changes. And that’s all I got. So I’ll pass it off to Joe to touch on structured notes.
Speaker2: [00:50:45] Yeah, real quick, just wanted to touch base on the April structured notes that are being offered for this month. As you can see, it’s three that we normally go with. We have our principal protected note at the top there that is fully, fully issuer protected and has full upside participation with the lesser of either the Dow Jones or Sp500. The second one being the absolute return growth note. You can see that I have the 1.25% uncapped upside participation and an absolute return, which means you get a positive return if they are down up to the 35% barrier. And then finally, our income note for this month is a one year, six month note. It has a non callable feature for six months and the contingent coupon as an annual payment of 10%. And it’s paid out monthly. We have created a new structured notes ticket in Zendesk, so if you’d like to be a part of the program, um, I send out monthly commentary and if you have any interest in these, you can send those in your trade tickets in. We just do ask that you send it in the week of close. So Monday the 24th, we will be on the lookout for automated tickets to get those sent in for sales. And on that note, I will pass back to Caleb.
Speaker6: [00:52:02] Thanks. Wanted to touch on the Zendesk ticket just to make it clear. I know we’ll probably send out some communication. A little bit different feature on the structured Notes ticket. For those of you who send us in multiple accounts to at one time to buy notes with the spreadsheet template that we Joe sends out. That template is attached on Zendesk at the top on the menu bar. The ticket has a feature where if you are including a spreadsheet with multiple accounts or multiple orders, you’ll be able to attach it and it can be for multiple accounts on one ticket. It does not have to be like our other trade request. It does not have to be a one ticket per account. You can do it as long as you fill the template out, you can do multiple.
Speaker1: [00:52:49] All right. Thanks, guys. So that is the end of our prepared comments for today. We’ve got, I think, about five minutes. I don’t see any questions in the chat. The only chat I got was Marcus helping me out on the mute side of things.
Speaker6: [00:53:09] I wonder if we have some people on spring break or something.
Speaker1: [00:53:11] Maybe it is spring break. I don’t know. Any anybody want to hop in and ask a question live before we sign off?
Speaker4: [00:53:28] Hey, guys, it’s Stephen. Yep. Hey, Stephen. Hey, one question I’ve got with the changes in all our sleeves and, you know, just. Just generally, you know how things operate. Let’s say that, you know, worst case scenario happens, right? The Fed does start to cut rates, as you as you mentioned. And I agree with this, you know, that doesn’t necessarily mean we’re going to get a run on equities. So, you know, we may even, you know, enter a new bear or extend the bear, whatever you want to call it. It if. You know, if we have, you know, a general feeling that, hey, we need to we need to become a little bit more risk off. Is that something specifically in the core portfolios that you guys would just go ahead and do or do we as advisors need to? You know, be you know, be cognizant of that, especially if we have, you know, you know, folks that want to be, you know, risk off. Like how tactical, I guess, is my question, to sum it up.
Speaker1: [00:54:33] Right. I think part of the answer there is, is our current positioning. So if we if we just look at correctly, if we just assume we’re talking about that like our current positioning in core equity, you know, we have already moved it to be more defensive in nature even when it comes to some of the manager changes. So last year we we we changed up our international allocation and included the Goldman Sachs International Fund, You know, and that’s just one example at the fund level that that fund manager has earned earned his money by outperforming in down markets. And so you know we’ve we’ve done a couple of things at the higher level as far as our allocation and and avoidance of, you know, overweights to high multiple growth companies that are going to be more volatile. So we’ve we’ve done that at a high level. And then even at the manager level, we’ve made some adjustments to try to, you know, provide more downside protection and better position us for for economic uncertainty. So so I guess I can say at least right now that’s part of our current positioning. What we’ve tried to do were things to deteriorate in a more pronounced way. You know, it’s not impossible that we wouldn’t see a need for another type of change to maybe position more defensively. But, you know, sometimes it’s hard to predict what exactly. Yeah. Could drive that or get us there.
Speaker1: [00:56:07] So I would say, you know, when it comes to like, so what do we actually do with the client? I think that, you know, your clients, your clients that made it through last year in core equity and we’re we’re able to to, for lack of a better term, survive that volatility that that they they didn’t blow you up they weren’t losing sleep over it you know they were able to work their way through it with with the core equity and diversified allocation that you’ve got together for them. You know, I think for those clients, I wouldn’t feel pressure to to to make a change. One thing I would say is if if you had clients where their risk tolerance was walked back during last year because of last year, you know they maybe they realized they were too risky. They couldn’t stomach whatever volatility they were experiencing or, you know, that’s just the way they are. If you’ve got clients where you you’ve kind of already pulled some risk off the table, I would say at this point I wouldn’t. With the rally we’ve had so far this year especially, I would be hesitant to. The change that now you know, if you if you felt like they needed to be a little bit more conservative last year, then I would kind of maintain that view I think over the course of this year.
Speaker4: [00:57:30] That’s great. Just to follow up to that, would we ever drift beyond our target? You know, allocations are, you know, I don’t know what our current target drift is. Maybe it’s like two, three, five. I don’t, I don’t remember the percentage. But would we ever, you know, would we ever drift if we felt, you know, felt like, hey, this is this might go in the wrong direction? Like, would that be a a tactical play in our core portfolios?
Speaker1: [00:57:57] Yeah. So, yeah, good question. It’s possible it’s worth noting, you know, we set those, those thresholds like Nick mentioned earlier, if we look at a big level. So, you know, from a core equity to core fixed over underweight over two and a half percentage points, that triggers a review and a discussion for us. So like if what Nick highlighted today had shown, shown that core equity was let’s, you know, let’s say it showed the core equity was underweight 2.5% relative to two core fixed. But our our outlook was still uncertain and we still weren’t maybe we didn’t feel like now was a great buying opportunity for for equities. You know it it breaching that threshold would generate that conversation but it’s not necessarily a given or a guarantee that it would generate a rebalance. So, you know, even if we got a signal right now or from a drift standpoint, we were going to add equity exposure, I you know, I think if we were there right now, it’s very likely that we would actually decide not to, because I would feel like this is not the time to increase our equity exposure after this rally that we’ve had that we think is kind of on, you know, less than solid footing.
Speaker4: [00:59:13] Well, yeah, I guess I guess on the other end, like would there be a situation where we where we decrease it within the allocation? So like say someone was in an I 50, would we ever go, hey, you know, we want, you know, we should go raise, you know, 10% and and just trigger everybody down 10% less in equities. I mean, like. Is that something that that you guys would do or is that something we, you know, like we need to do if y’all see that? And would you guys give us indication that you’re starting to see some of these signs? Yeah.
Speaker1: [00:59:42] So, no, we we wouldn’t make a shift like that because, you know, our view is still that like a shift in allocation like that really needs to be tied to the client’s risk tolerance. And since we don’t know the client’s risk tolerances, we just manage the allocations. That’s why we wouldn’t make that kind of change, because I still think, you know, we’re long term investors here and over the long run, you know, the over the long run, I think a 60 over 40 client over ten years plus is if they’re really a 60 over 40 client, then their best scenario is to stay 60 over 40 for for that period. But if their situation changes or their risk tolerance is lower, if again, if 2022 showed them that their risk tolerance isn’t as high as maybe they thought it was, then that can be a reason to to make that shift. But, you know, there’s so there’s one reason, again, that I mentioned the risk tolerance and and how I think it’s more tied to a client’s individual risk tolerance with those decisions. The other piece too, is we, you know, we have to put some. Some guardrails on our cells where even if things look dire, we know that over the course of history, markets have trended higher and we know that unforeseen things happen all the time. And so for that reason too, I think it’s hard to say that we would want to get in the habit of wholesale across the board, reducing clients equity allocations, for example, if our outlook wasn’t as positive. Yeah.
Speaker4: [01:01:25] Appreciate it.
Speaker5: [01:01:26] Yep.
Speaker1: [01:01:27] Good questions. Thanks for chiming in. I know we’re a few minutes past 11 now so we can sign off unless somebody else wants to jump in real quick at the buzzer here. All right. Thank you, everybody, for your time. Appreciate you joining. And we will see you in a month.
Disclosure
This material is for general information only and is not intended to provide specific advice or recommendations for any individual. There is no assurance the views or strategies discussed are suitable for all investors or will yield positive outcomes. Investing involves risks including possible loss of principal. Any company names noted herein are for educational purposes only.
All information is believed to be from reliable sources; however we make no representation as to its completeness or accuracy. All economic and performance data is historical and not indicative of future results. Market indices discussed are unmanaged. Investors cannot invest in unmanaged indices. Additional risks are associated with international investing, such as currency fluctuations, political and economic instability and differences in accounting standards.
Investing in securities in emerging markets involves special risks due to specific factors such as increased volatility, currency fluctuations and differences in auditing and other financial standards. Securities in emerging markets are volatile and can decline significantly in response to adverse issuer, political, regulatory, market, or economic developments.
An index is a statistical measure of change in an economy or a securities market. In the case of financial markets, an index is an imaginary portfolio of securities representing a particular market or a portion of it. Each index has its own calculation methodology and is usually expressed in terms of a change from a base value. Thus, the percentage change is more important than the actual numeric value. An investment cannot be made directly into an index.
Investing in fixed income securities involves credit and interest rate risk. When interest rates rise, bond prices generally fall. Investing in commodities may involve greater volatility and is not suitable for all investors. Investing in a non-diversified fund that concentrates holdings into fewer securities or industries involves greater risk than investing in a more diversified fund. The equity securities of small companies may not be traded as often as equity securities of large companies so they may be difficult or impossible to sell. Neither diversification nor asset allocation assure a profit or protect against a loss in declining markets. Past performance is not an indicator of future results.
Financial Planning offered through Reason Financial, a state Registered Investment Advisor. Investment advice offered through Merit Financial Group, LLC an SEC Registered Investment Advisor. Merit Financial Group and Reason Financial are separate entities. Tax related services offered through Reason Tax Group. Reason Tax Group is a separate legal entity and not affiliated with Merit Financial Group, LLC. Sean P. Storck CA Insurance Lic#OF25995 and Steven W. Pollock CA Insurance Lic#OE98073
Copyright © 2026 Reason Financial all rights reserved.
Continue Reading
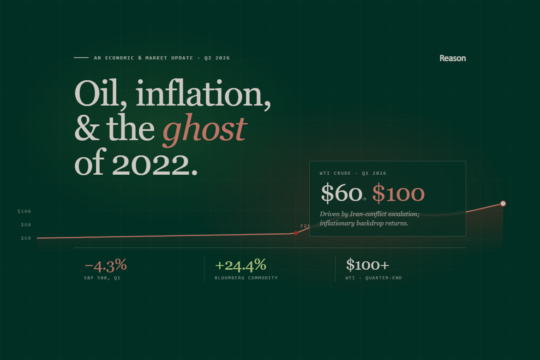
2nd Quarter 2026 – Economic and Market Update
Q1 2026 in review: oil shock, S&P 500 down 4.3%, commodities up 24.4%, the cease-fire that became a blockade — and the planning moves that matter most coming out of a quarter like this one.
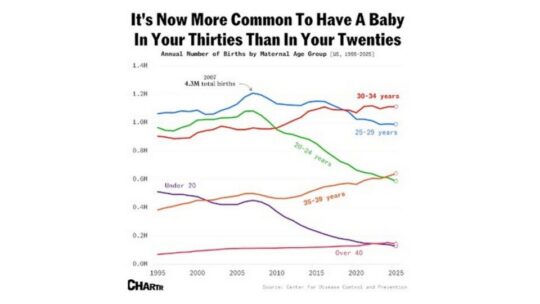
It’s Now More Common To Have A Baby In Your Thirties Than In Your Twenties
DisclosureThis material is for general information only and is not intended to provide specific advice or recommendations for any individual.…

When Does Refinancing Actually Make Sense? A 2026 Reality Check
If you locked in a mortgage at 7% or higher in 2023 or 2024, you’ve probably been watching rates with…