October 2020 – Economic and Market Update
Executive Summary
- The stock market this year is a study in contrasts. Growth is in and value is way, way out.
- The National Debt has exploded, “Shhh, don’t tell the 30-year old’s that they are going to have to pay it back”.
- Don’t be average: save early, save often.
It was the best of times, it was the worst of times, it was the age of wisdom, it was the age of foolishness…
Charles Dickens, A Tale of Two Cities
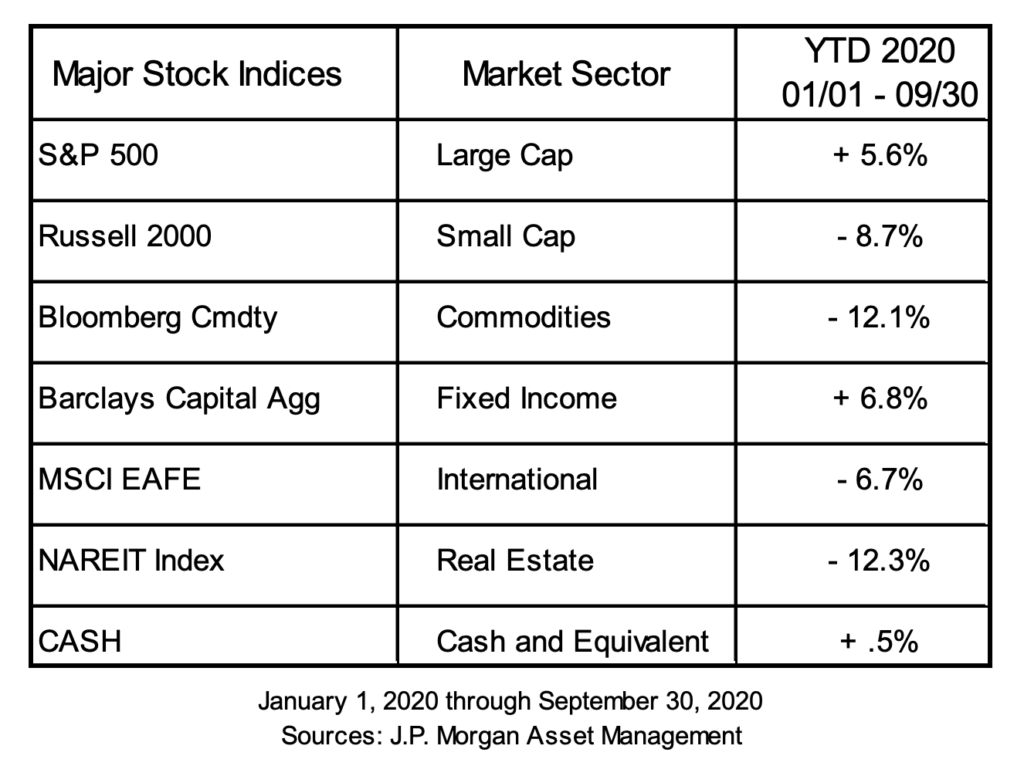
A core tenet of our investing philosophy is to invest with flexibility. Our definition of this is as follows – a good investment process should allow for flexibility to adapt as the investment landscape changes. This year has been a near daily reminder of how important this tenet can be. We have been far more active than usual as we focus on navigating our way around the various dangers we see ahead, and in some cases, behind us. To date the S&P 500 is up 5.6%, but that data point only reveals a small sliver of what has happened to stocks. As you can see in the chart below, value has done very poorly in comparison to growth. Since the market peak of mid-February there is a cumulative 26.4% outperformance of large-cap growth relative to large-cap value.
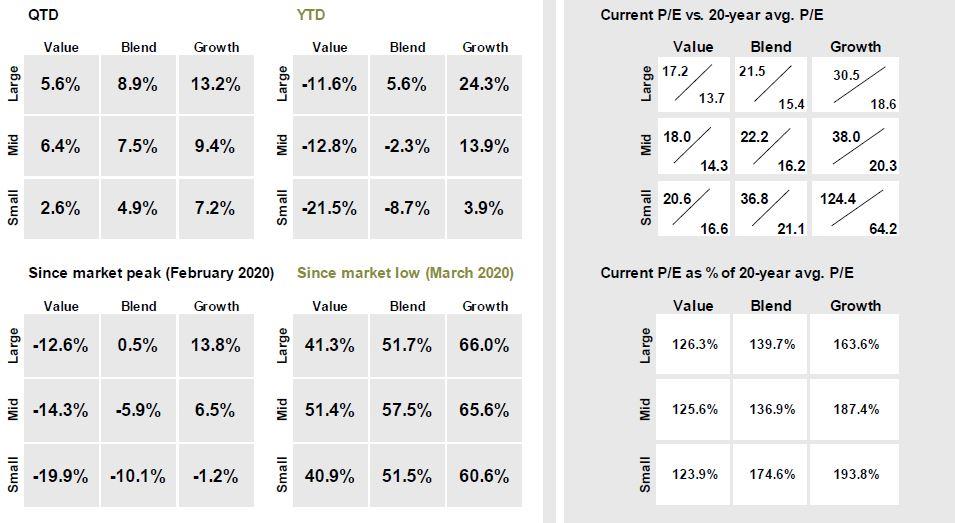
We have made multiple moves over the course of the year to reduce our value exposure while increasing growth, and those moves appear to be paying dividends. Like all trends in the stock market this one will come to an end as well, but for now, we will enjoy the ride. To put some additional perspective on how much of a tale of two stock markets this is, one need only look at the share of S&P 500 market cap represented by the top 5 stocks. The top 5 companies by market cap are now Apple, Microsoft, Amazon, Facebook and Google representing 22.6% of the total S&P 500. Meaning, you are effectively investing a large chunk of your assets in tech just by investing in an index fund tracking the S&P. This is a larger share than during the dotcom bubble of the late 90’s and early 00’s.,
In addition to making significant changes to the makeup of our equity portfolio, we have been similarly active in our fixed income holdings. In his most recent press conference, Federal Reserve Chairman Jerome Powell referenced that, “in the early spring when the acute phase of the pandemic hit, market function was very low”. He was specifically referencing the financial markets. During this phase we became very conservative with our fixed income holdings and shifted to short duration treasuries as a way of protecting against any difficulties in the bond space. Thankfully, the forceful actions of the Fed removed the concerns around a new financial crisis and we have since fully diversified our fixed income holdings once again. Due to the very low interest rate environment we have more recently expanded our mortgage-backed securities holdings and reduced or eliminated our ultra-short duration treasury holdings. Our expectation is for this to remain the case for some time, particularly as Federal Reserve interest rate projections are for rates to remain at or near zero into 2023.
Flexibility has been key to a successful portfolio recovery from the shock of February and March. The economic recovery appears to be moving ahead as well with a recent GDP growth estimate for 3rd quarter 2020 of +33.1% after the disastrous 2nd quarter reading of – 31.4%. As always, we expect this number to be revised later in the quarter, but regardless of the change come late Nov., it was a strong rebound. That said, future quarters should show far more muted growth. Most of what could be opened quickly, has been opened. The trend lines for data activity as seen below are a good indication of the continued headwinds facing the economy.
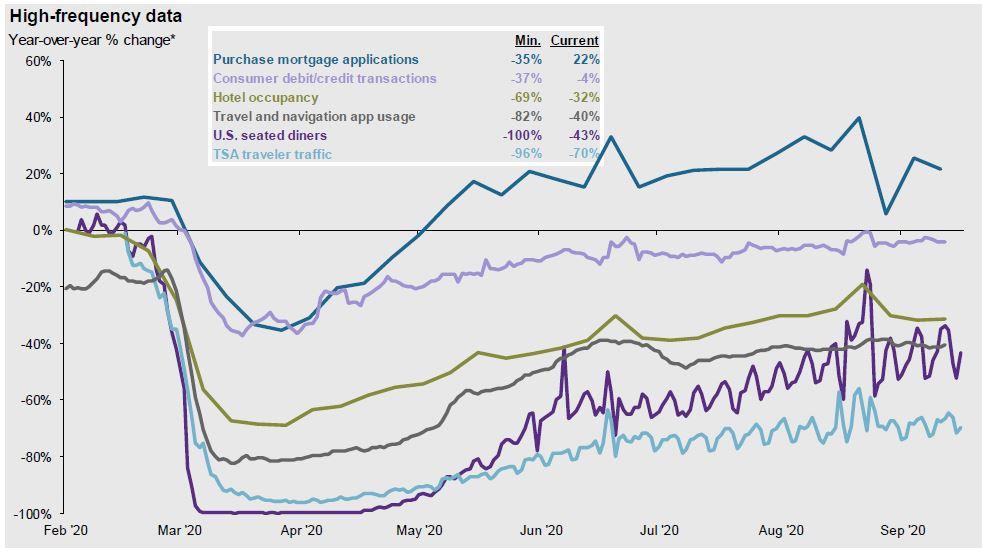
Again, there are clear winners such as housing and retail. Travel related sectors, however, are a completely different story. The trend lines suggest it will take a lot longer to get back to where we were. With varying restrictions in place nationwide and a third virus wave working its way through the system, we do not expect the hardest hit sectors to recover anytime soon. Until then, a large chunk of potential GDP inputs are likely to remain persistent underperformers. It was the best of times, it was the worst of times.
The Federal Debt
A very popular question since the beginning of the virus crisis has been some variation of how the huge increase in the Federal Debt will impact the economy in the long run. At a micro level we understand how debt impacts our household by increasing debt servicing which in turn raises fixed costs and reduces our ability to spend on consumption today and invest in our future tomorrow. To resurrect the idea of a lemonade stand model to understand complex ideas, let’s bring back Little Susie.
Inspired by the county fair, Little Susie decides she wants the mother of all lemonade stands. A pop-up card table, some cardboard signs, and the pitchers from up in the cupboards just won’t do. So Little Susie borrows from her parents to build a state-of-the-art lemonade stand and, in turn, Susie’s parents require payment on a schedule as Susie begins to make money selling lemonade. It is important to note that they could have put her through a rigorous lending process and audited her business plan to determine her credit worthiness, but they do not.
Now, instead of having only the cost of inputs prior to making a profit, she must also cover her loan payments. She will have to charge a price that will cover this debt, in addition to her inputs. If business is slow, that means cutting corners on things like the type of sugar, lemons and water she will use to make the lemonade. Organic sugar is out the window, tap water instead of fancy filtered water from the water store, and the lemons will be whatever is cheapest. This also means that when she gets busy, being able to afford Little Johnnie will be hard. He will have to work for less since the profit margin just isn’t there to pay him a good wage or she will have to go back to her parents for another loan to re-invest in the business, adding again to her fixed overhead in the form of additional debt servicing. Not a good feeling…especially when Little Susie has to go back to her familial noteholders and let them know her payment is going to be late because it rained the last two Saturdays and business just wasn’t what it was supposed to be. Thankfully, Little Susie still has a place to live since she has gracious parents, but things are a little strained at the dinner table, especially since the only thing to drink is the 10 gallons of cheap lemonade her parents bought from her so that she could pay back her loan.
At the macro level this gets murky. The taxpayer is a lot like Little Susie’s parents, with some caveats, but the taxpayer is also Little Susie. The day the debt becomes a problem is when the taxpayers who effectively loan the money are then called upon to also pay it back. The ability to pay has a lot to do with the number of taxpayers (tax base), labor productivity (how efficient the worker is at generating value), inflation, wage growth, and interest rates. A large, productive tax base with rising wages, moderate inflation, and debt with low interest rates works well. If any one of these inputs goes sideways things can get challenging. The U.S. is in a good position right now. Interest rates are low, pre-Covid wages were rising across the board, and the tax base is potentially the largest it has ever been in the country. Below is a population demographic tree for the United States compared with Germany.


Source: CIA World Factbook
From the CIA World Factbook – The population is distributed along the horizontal axis, with males shown on the left and females on the right. The male and female populations are broken down into 5-year age groups represented as horizontal bars along the vertical axis, with the youngest age groups at the bottom and the oldest at the top. The shape of the population pyramid gradually evolves over time based on fertility, mortality, and international migration trends.
The wide sections of the graph illustrate larger cohorts and the narrower sections illustrate smaller cohorts. Visually, it is easy to see that Germany lacks younger populations (future taxpayers) relative to older populations (retiring taxpayers). The U.S., in contrast, seems to be in okay shape. The widest section of our population tree represents the current 25 – 34-year-old population. This large cohort will serve as the backbone of productivity and tax revenue for the next 40 years. If everything turns out right, they will be able to support debt servicing for the next 40 years. The problem is if future generations in the U.S. continue to trend smaller like in Germany.
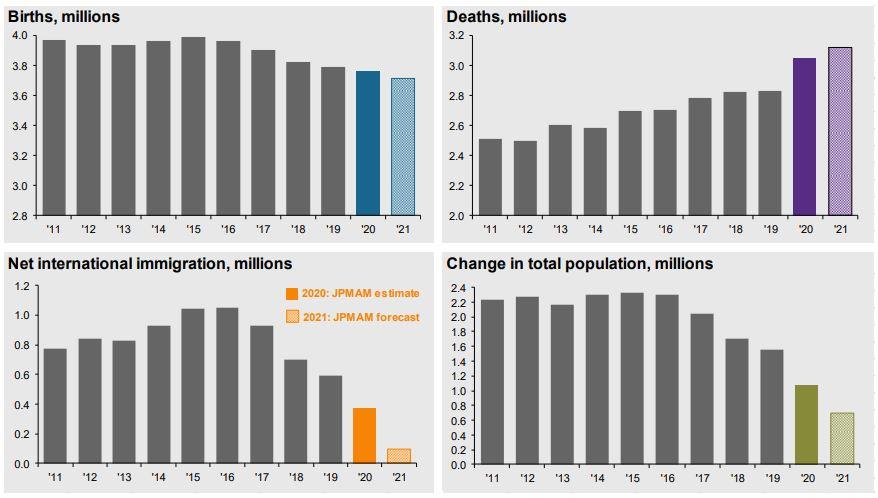
Guide to the Markets – U.S. Data are as of September 30, 2020
The graphs above, illustrate what has happened to our population in the last decade. The major inputs have been trending down with both birthrates and immigration tilting south. If this trend holds, it makes sense to say that the farthest the debt can be kicked down the road is 30 years or so until it really becomes a problem. This conclusion is drawn from making a loose assumption that the largest generation is already alive and entering their prime working years, and all future generations after them will be smaller.
The debt is a problem, but it appears to be more of a generational problem versus an imminent problem. It is like the gut check Little Susie has when she wakes up and looks at the 10-day weather forecast. Rain is called for and she can already tell that her payment to her creditors is likely to be a little short or a little late. However, she doesn’t have to pay up today, and she has just enough hope that maybe the weatherman is wrong this time.
The Planning Corner
Contributing to your retirement plan is foundational to financial planning. Preparing for tomorrow by being wise with your dollars today. It is imperative that we not do what most of our peers are doing when it comes to planning for retirement. TheStreet.com recently aggregated data from Fidelity Investments regarding average 401(k) balance by age and the data is presented to you in the graph below.
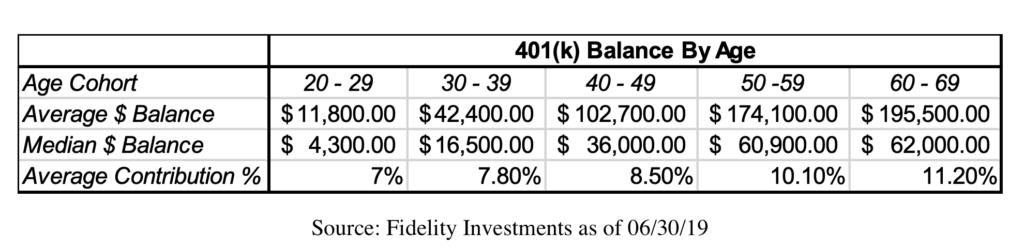
The data makes sense, but it is still sad. In the younger age ranges contribution rates are lower. This is the period of life where the combo of debt servicing and entry-level wages put the biggest hurt on someone’s abilty to save. It is, however, precisely when you should be trying to get the most dollars invested in your future as possible from a time value of money perspective. As a general rule, you should be saving between 15% and 20% of your earnings. The older cohorts still fail in this, even though the reality of retirement is pending and there should be a greater pull to save for the drawdown years which are now around the corner.
It is always a good time to look at what you are doing with your retirement savings. Some tips are as follows:
- Contribute to your 401k – to the highest level you feel like you can.
- Increase your percentage withholding by at least 1% per year until you hit the 15% to 20% target.
- Invest in a diversified and thoughtful way – we can help you understand your options. At a minimum, utilize the Target Date fund that aligns with your likely retirement start date.
- Don’t use your retirement funds for anything other than retirement. Aside from the tax penalties, when you pay for consumption today with dollars earmarked for tomorrow, you are only robbing your future self.
We are often asked where our clients land in relation to their peers when it comes to savings. A snapshot quantitative assessment can tell us something, but it cannot tell us everything. Our hope is that we will be able to partner with you and participate in the joy of watching a definitively better than average outcome take place.
CLOSING THOUGHTS
The election is nearly upon us and most of you have already voted; all of us here at Reason Financial have. We will say that it feels a bit anti-climactic to wear an “I Voted” sticker around the office, a month before the election, after sticking your ballot in the mail. What we see ahead from a market standpoint is a variety of best guesses based on various talking points by both the incumbent and the contender. In either case, it is likely we will see an additional stimulus package. This has been pointed out by Fed Chair Powell often, with his most recent statement being that, “more fiscal support is likely to be needed”. Coming from a very measured and conscientious speaker these are big words. The election results may slow the development of a second round of stimulus but we expect one will be announced in the coming months once there is definition around the faces of the next Congress and White House. Any additional fiscal stimulus should spur economic growth in the short run and would help balance out the disparity in experience between those who are still able to work versus those who have been shutdown due to Covid related restrictions.
Aside from the fiscal stimulus package we expect to see, everything else at this point in time is pure speculation. Hopefully, we will have more clarity one week from now. Trade and taxes being the two issues most likely to receive attention quickly and in very divergent directions dependent on the next administration.
Two things you should be looking at right now if you have not done so already: take advantage of the low mortgage and refinance rates and explore options for your cash on hand. The bank is paying nothing or nearly nothing in interest. Our go to high-yield savings account recommendation is languishing around the .6% mark, better than the brick and mortar banks, but anemic by any definition. If you want to increase yield we have been working diligently at building fixed income portfolios which can meet this need, as appropriate. Emergency funds are emergency funds for a reason and we are very cognizant of the balancing act between principal protection and reaching for yield.
As always, our desire is to help you make rational, informed and well-reasoned decisions, and we thank you for your continued trust and support. Your input is always welcome, and we ask that you contact us with any questions or concerns.
DISCLOSURE
All information is believed to be from reliable sources; however we make no representation as to its completeness or accuracy. All economic and performance data is historical and not indicative of future results. Market indices discussed are unmanaged. Investors cannot invest in unmanaged indices. Additional risks are associated with international investing, such as currency fluctuations, political and economic instability and differences in accounting standards.
Investing in securities in emerging markets involves special risks due to specific factors such as increased volatility, currency fluctuations and differences in auditing and other financial standards. Securities in emerging markets are volatile and can decline significantly in response to adverse issuer, political, regulatory, market, or economic developments.
An index is a statistical measure of change in an economy or a securities market. In the case of financial markets, an index is an imaginary portfolio of securities representing a particular market or a portion of it. Each index has its own calculation methodology and is usually expressed in terms of a change from a base value. Thus, the percentage change is more important than the actual numeric value. An investment cannot be made directly into an index.
Investing in fixed income securities involves credit and interest rate risk. When interest rates rise, bond prices generally fall. Investing in commodities may involve greater volatility and is not suitable for all investors. Investing in a non-diversified fund that concentrates holdings into fewer securities or industries involves greater risk than investing in a more diversified fund. The equity securities of small companies may not be traded as often as equity securities of large companies so they may be difficult or impossible to sell. Neither diversification nor asset allocation assure a profit or protect against a loss in declining markets. Past performance is not an indicator of future results.
Sean P. Storck and Steven W. Pollock are registered representatives with and securities and Retirement Plan Consulting Program advisory services offered through LPL Financial, a Registered Investment Advisor. Member FINRA/SIPC. Financial Planning offered through Reason Financial, a state Registered Investment Advisor. Investment advice offered through Merit Financial Group, LLC an SEC Registered Investment Advisor. Merit Financial Group and Reason Financial are separate entities from LPL Financial. Tax related services offered through Reason Tax Group. Reason Tax Group is a separate legal entity and not affiliated with LPL Financial. LPL Financial does not offer tax advice or tax related services. Sean P. Storck CA Insurance Lic#OF25995 and Steven W. Pollock CA Insurance Lic#OE98073
Copyright © 2019 Reason Financial all rights reserved.
1 “The 20 Largest Holdings in the S&P 500 Index.” Investopedia, Investopedia, 28 Aug. 2020, www.investopedia.com/articles/investing/053116/10-largest-holdings-sp-500-aaplamznfb.asp.
2 J.P. Morgan Guide to the Markets – U.S. data are as of September 30, 2020, Slide 11, https://am.jpmorgan.com/blob-gim/1383407651970/83456/MI-GTM-4Q20.pdf
3 “Gross Domestic Product, Third Quarter 2020 (Advance Estimate)”, Bureau of Economic Analysis, U.S. Department of Commerce, 30 Oct. 2020, https://www.bea.gov/sites/default/files/2020-10/gdp3q20_adv.pdf